Figure 1.

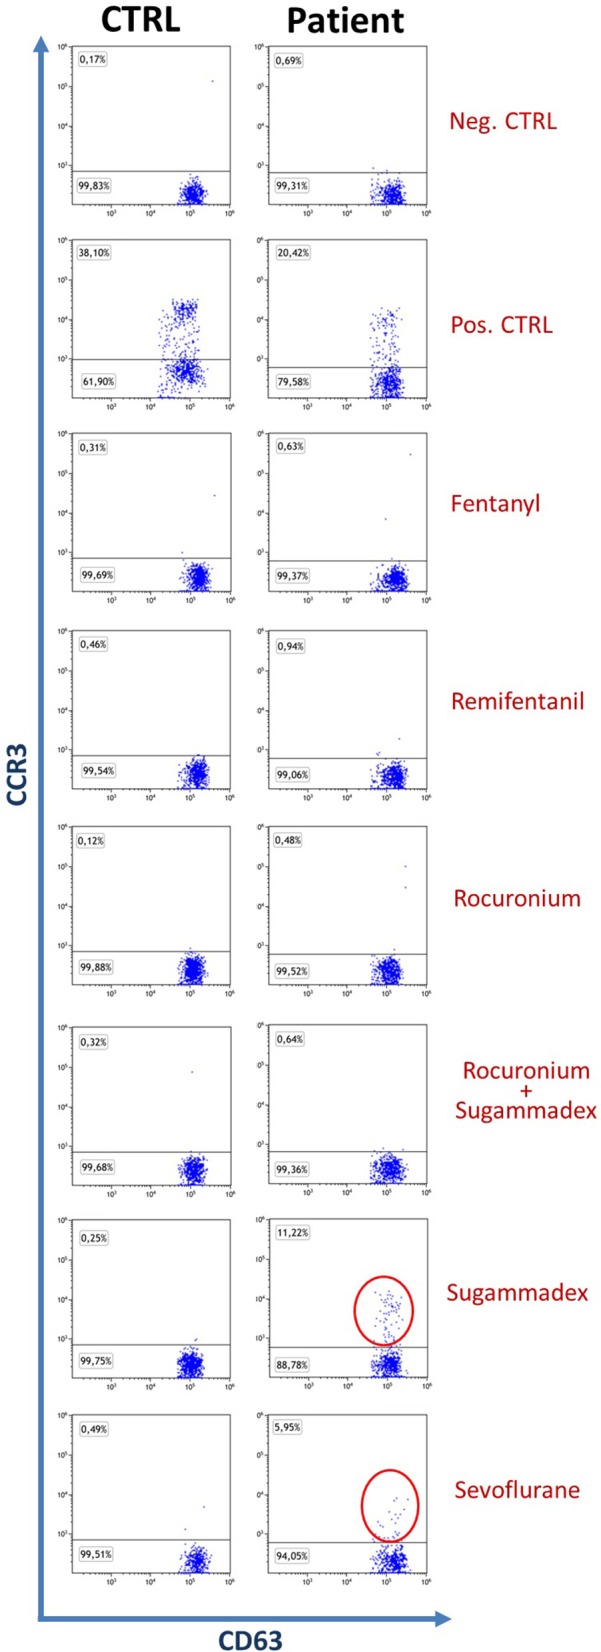
Dot plot of patient and control basophils (SSClowCCR3+CD63+), the control shown is representative of three. The percentage of patient positivities is highlighted with red circles.

Dot plot of patient and control basophils (SSClowCCR3+CD63+), the control shown is representative of three. The percentage of patient positivities is highlighted with red circles.