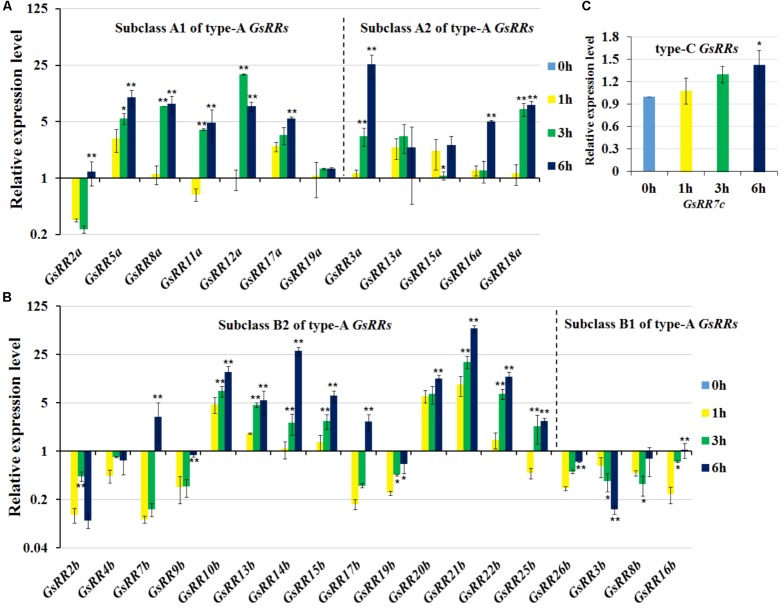
FIGURE 6.
Expression profile of GsRR family genes under salt stress. (A–C) The expression patterns of GsRRs were measured by qRT-PCR analysis with G. soja seedlings treated with 200 mM NaCl. Values represent the means of three fully independent biological replicates, and three technology replicates for each. ∗P < 0.05, ∗∗P < 0.01 by Student’s t-test.

