Figure 1.
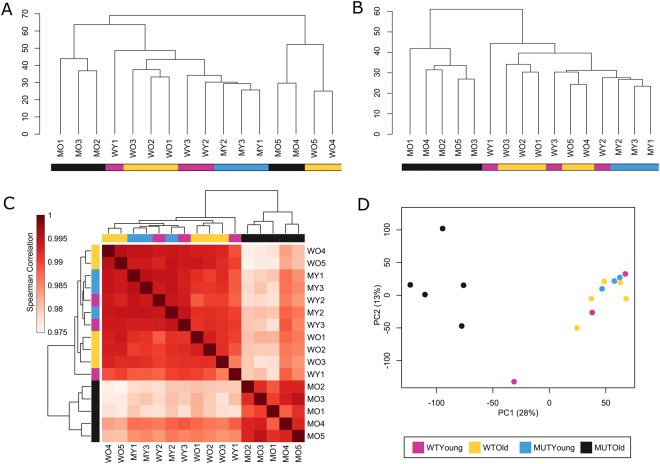
Analysis of 16 spinal cord samples based on normalized expression values of 18,167 genes. (A,B) Unsupervised hierarchical clustering. (A) Separation of batch 1 and batch 2; no batch-effect correction. (B) Post-batch-effect correction; batch separation minimized, and clearly separate clustering of MO samples from the other samples. (C) Heatmap showing the pair-wise Spearman’s rank correlation between all samples and clustering of MO samples apart from the other three groups. (D) PCA plot of samples in which MO mice are clustered away from the other three groups.

