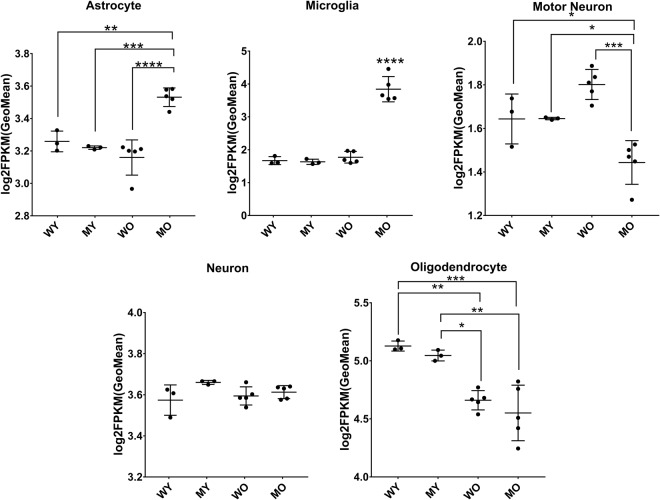
Figure 2.
Cell-type composition of spinal cord samples. Changes in specific cell types indicated by geometric mean of the log2(1 + FPKM) values of cell-type marker genes for each cell type. Statistical differences in cell type composition are calculated by the Tukey Kramer test. Number of marker genes used per cell type: 60 for astrocyte, 5 for microglia, 5 for motor neuron, 72 for neuron, and 35 for oligodendrocyte. Error bars indicate SD; *P < 0.05, **P < 0.01, ***P < 0.001, ****P < 0.0001.

