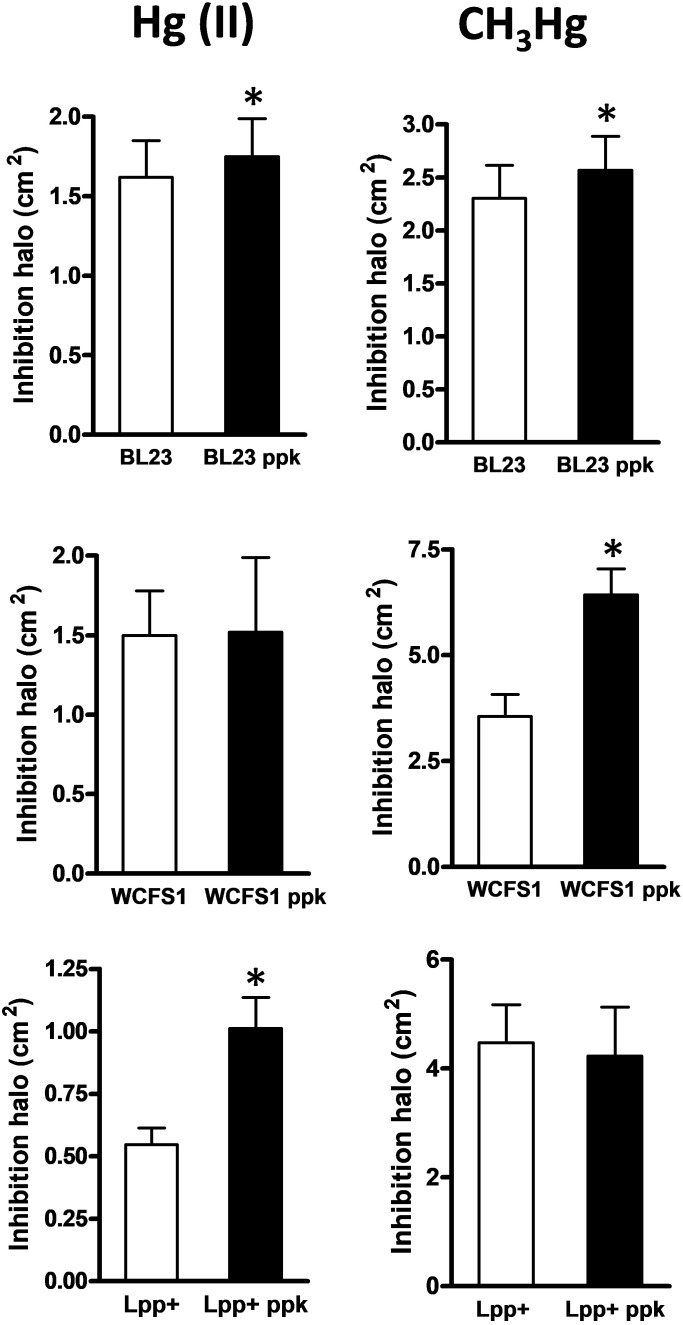
FIGURE 2.
Growth inhibition by mercury in Lactobacillus strains and their respective ppk mutants. The graphs represent the areas of the inhibition halos produced by inorganic [Hg(II), left column] and organic (CH3Hg, right column) mercury in wild type and ppk strains. Data are means plus standard deviations (n = 20–55). The asterisks indicate a significant difference (p < 0.01).

