Fig. 3.
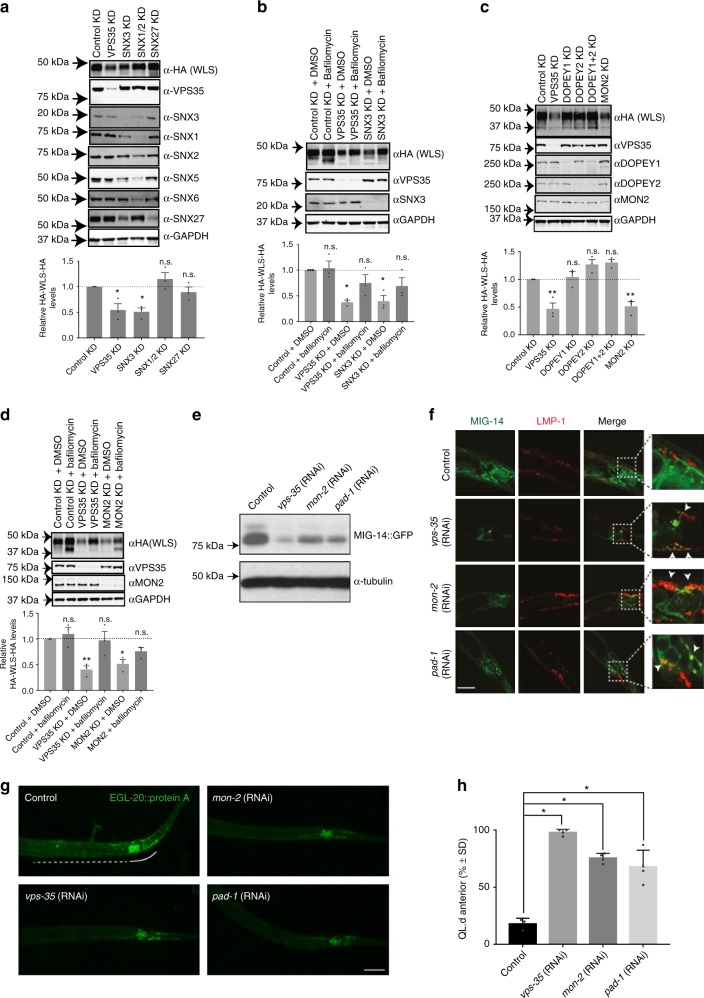
MON2-DOPEY2 complex is required for SNX3-retromer-mediated sorting of Wls. a RNAi-mediated suppression of VPS35, SNX3, SNX1 and SNX2, or SNX27 in RPE-1 cells stably expressing HA-WLS and quantification of HA-WLS levels. b Inhibition of lysosomal degradation through Bafilomycin A1 treatment (100 nM for 16 h) restored total protein levels of HA-WLS following RNAi-mediated suppression of VPS35 or SNX3. c RNAi-mediated suppression of VPS35, DOPEY1, DOPEY2, DOPEY1 + DOPEY2 or MON2 reveals that the total protein levels of HA-WLS is dependent on the function of VPS35 and MON2. d Bafilomycin A1 treatment (100 nM for 16 h), inhibiting lysosomal degradation, prevents loss of HA-WLS protein levels following VPS35 and MON2 suppression using RNAi. a–d Data presented as mean +/− s.e.m. from three independent biological replicates. Significance was determined using a one-way ANOVA with a post-hoc Dunnett’s test; *p < 0.05. e Representative western blot of endogenously expressed MIG-14::GFP (huSi2) protein levels in animals treated with control, vps-35, mon-2 or pad-1 RNAi. f Confocal imaging of MIG-14::GFP (green, huIs72) and the late endosomal and lysosomal marker LMP-1::mCherry (red, huEx149) in L1 larvae. The tail area, which includes the EGL-20 producing cells, is shown. Arrows indicate regions of colocalization. In all images, anterior is left and dorsal is up. Scale bar is 10 µm. g Staining of EGL-20::protA with rabbit-anti-goat-Alexa647 in L1 larvae. The EGL-20 producing cells are indicated with a solid line, the punctate gradient that is formed by EGL-20::protA is indicated with a dashed line. In all images, anterior is left and dorsal is up. Scale bar is 10 µm. h Systemic knock down of mon-2 or pad-1 interferes with the EGL-20/Wnt dependent posterior migration of the QL descendants (QL.d) in a vps-29(tm1320) sensitised genetic background. The percentage of animals with anteriorly displaced QL.d is shown (data are presented as mean +/− SD and include results from four independent biological replicates, with n ≥ 25 per replicate) *p = 1.158 × 10⁻⁶ for vps-35 RNAi, *p = 1.44 × 10⁻⁵ for mon-2 RNAi and *p = 0.0024 for pad-1 RNAi (Student’s t-test)

