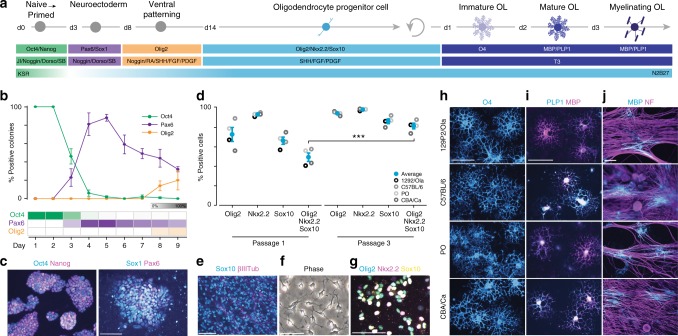
Fig. 1.
Reproducible generation of OPCs and oligodendrocytes from mESCs. a Graphical overview of the differentiation time course for generating OPCs and stage-specific oligodendrocytes from mESCs. b Quantification of immunocytochemistry for stage-specific markers demarcating the transition from pluripotency (Oct4) to neuroectoderm (Pax6) to ventral neural tube (Olig2) over 9 days. n = 4 independent biological replicates (mESC lines) with >25 colonies scored per cell line. Data are represented as means ± SEM. c Representative immunofluorescent images of starting mESCs (Oct4 and Nanog) and day 5 neuroectoderm (Pax6 and Sox1). Scale bar, 50 µm. d Quantification of OPC-defining transcription factors Olig2, Nkx2.2, and Sox10 at passages 1 and 3 of the differentiation protocol. n = 4 independent mESC lines; >114,500 cells scored per cell line. Data are represented as means ± SEM. ***P value <0.001; unpaired t test. e Immunofluorescent image of passage 1 cultures stained for Sox10, an OPC marker, and βIII-Tubulin, a marker of neurons. Scale bar, 50 µm. f Representative phase contrast image of mESC-derived OPCs exhibiting a canonical bipolar morphology. Scale bar, 50 µm. g Immunostained image of passage 3 mESC-derived OPCs co-expressing Olig2, Nkx2.2, and Sox10, canonical OPC transcription factors. Scale bar, 50 µm. h Cell surface immunostaining of the immature oligodendrocyte marker O4, after treatment with T3. Scale bar, 50 µm. i Representative images of differentiated OPCs immunostained for mature oligodendrocyte markers MBP and PLP1, 72 h post treatment with T3. Scale bar, 50 µm. j Representative images of OPC/DRG co-cultures stained for MBP and neurofilament (NF) at day 10. Scale bar, 50 µm. Unless otherwise noted, images presented in Fig. 1 are derived from the CBA/Ca mESC line, and are representative of results obtained with C57BL/6, PO, and 129P2/Ola lines, which are shown separately in Supplementary Fig. 2

