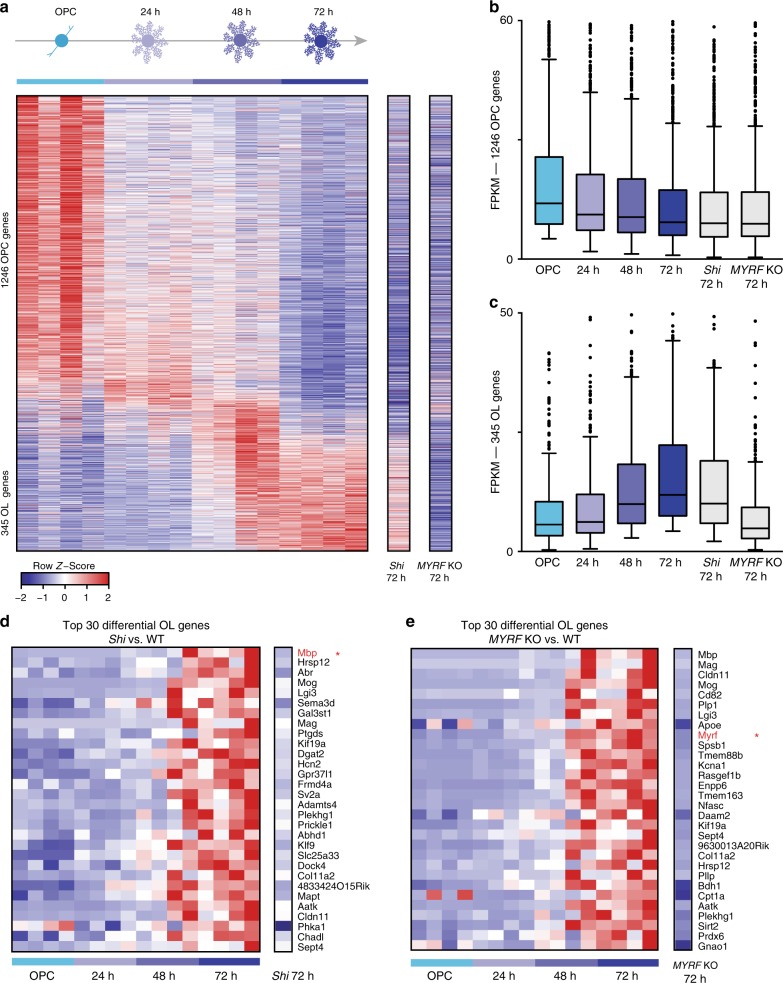
Fig. 3.
Molecular profiling of spontaneous and purposely generated mutant oligodendrocyte alleles. a Row normalized heatmap with genes (rows) sorted by time of maximum (TOM). The four independent WT mESC lines for each time point are shown compared to gene expression of shiverer and MYRF KO OPCs 72 h post T3 induction. b Boxplot of OPC-signature genes prior to T3 induction and after differentiation with T3 for 24, 48, and 72 h. c Boxplot of oligodendrocyte-signature genes prior to T3 induction and after differentiation with T3 for 24, 48, and 72 h. d Row normalized heatmap of the top 30 dysregulated oligodendrocyte-signature genes for shiverer 72 h post T3 induction. Gene expression for the four WT mESC strains for each time point are shown compared to gene expression of shiverer OPCs 72 h post T3 induction. Note the lack of MBP expression (red star). e Row normalized heatmap of the top 30 dysregulated oligodendrocyte-signature genes for MYRF KO OPCS at 72 h post T3 induction. Gene expression for the four WT mESC strains for each time point are shown compared to gene expression of MYRF KO OPCs 72 h post T3 induction. Note the lack of MYRF expression (red star)

