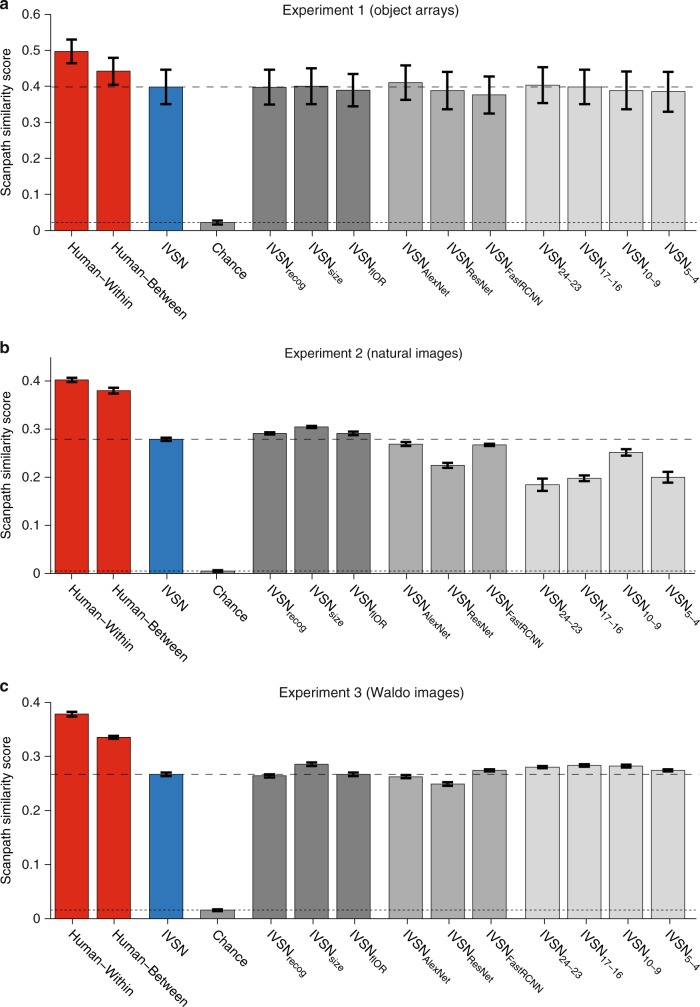
Fig. 6.
Image-by-image consistency in the spatiotemporal pattern of fixation sequences. Scanpath similarity score (see text and Methods for definition) comparing the fixation sequences within subjects (first red column), between-subjects (second red column), between the default IVSN model and humans (blue column), and between all other models and humans (gray). Results are shown for Experiment 1 (a), Experiment 2 (b), and Experiment 3 (c). The larger the scanpath similarity score, the more similar the fixation sequences are. We considered sequences up to length 6, 30, and 80 in a, b, and c, respectively. Supplementary Figure 8A-C shows results comparing entire sequences and Supplementary Figure 8D-F shows results comparing scanpath similarity scores as a function of sequence length. The horizontal dashed line shows the IVSN-human similarity score and the dotted line shows the chance-human similarity score. Error bars denote SEM, n = 15 subjects. The within-subject similarity score was higher than the between-subject score in all 3 experiments (p < 10−9). The between-subject similarity score was higher than the IVSN-human score in all 3 experiments (p < 10−15) and the IVSN-human similarity scores were higher than human-chance scores in all 3 experiments (p < 10−15)

