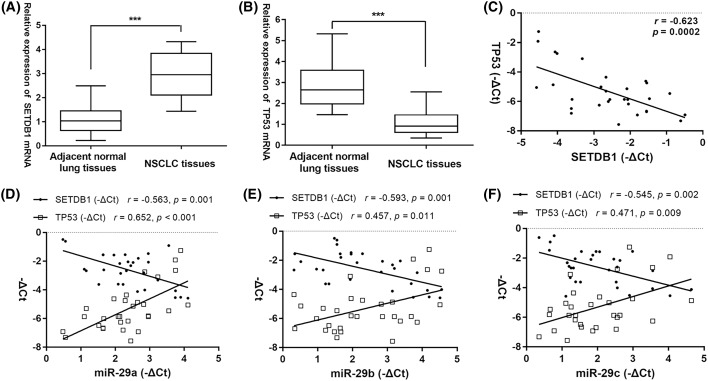
Figure 5. The correlation of TP53, miR-29s, and SETDB1 expression levels in NSCLC.
(A) SETDB1 mRNA levels and (B) TP53 mRNA levels in primary NSCLC samples and their paired adjacent normal samples. (C) SETDB1 and TP53 mRNA levels were inversely correlated in primary NSCLC samples. (D–F) Pearson correlation analysis between miR-29s and SETDB1 mRNA levels, as well as between miR-29s and TP53 mRNA levels in primary NSCLC samples. ***P<0.001

