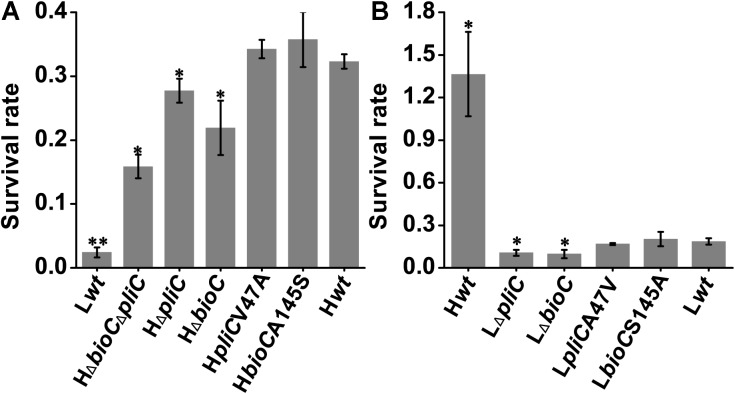
FIGURE 3.
Survival of bioC and pliC mutants in egg whites. The survival rates of bacteria represented as the ratio of the concentration of bacteria at 24-h/0-h samples incubated at 37°C with starting inocula of approximately (A) 2 × 10³ and (B) 2 × 10⁴ CFU/mL (the initial concentration increased by an order of magnitude here because the survival rates of SJTUF10984 and its mutants in egg whites were too low to distinguish between each other when the inoculum concentration was 2 × 10³ CFU/mL). Survival rate is shown as the mean ± standard deviation. Experiments were repeated three times and results from one representative experiment were presented. ∗p < 0.05 and ∗∗p < 0.01, two-tailed t-test.

