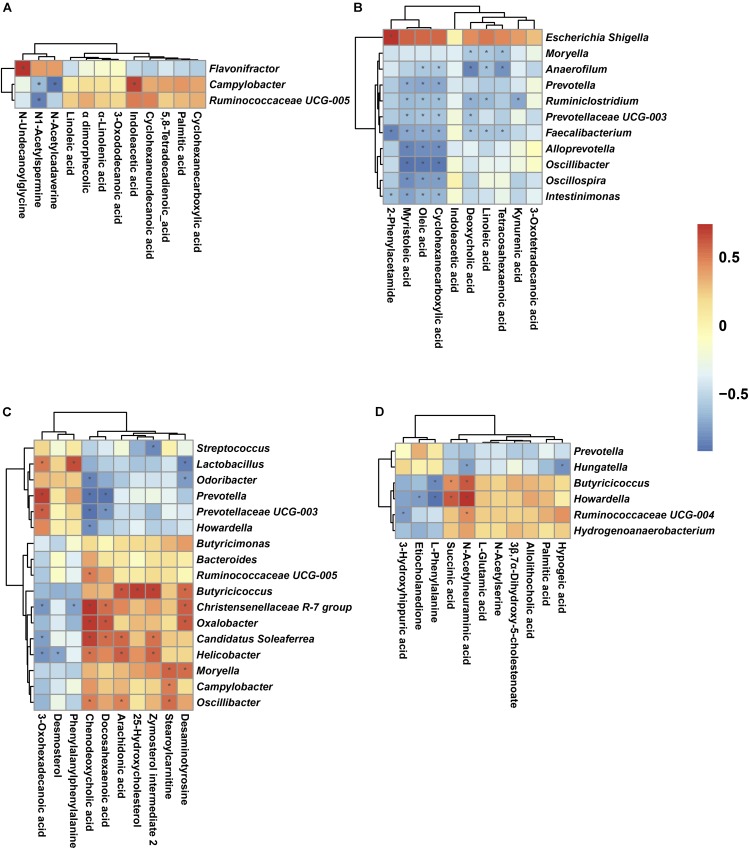
FIGURE 7.
Spearman correlation analysis between genera and metabolite concentrations affected by birth weight on D7 (A), D14 (B), D21 (C), and D35 (D). Asterisks indicate significant correlations between LBW and NBW piglets. Cells are colored based upon the Spearman correlation coefficient between the significantly altered genera and metabolites; the red represents a significantly positive correlation (P < 0.05), the blue represents a significantly negative correlation (P < 0.05), and the white represents no significant correlation (P > 0.05). n = 6 per group.

