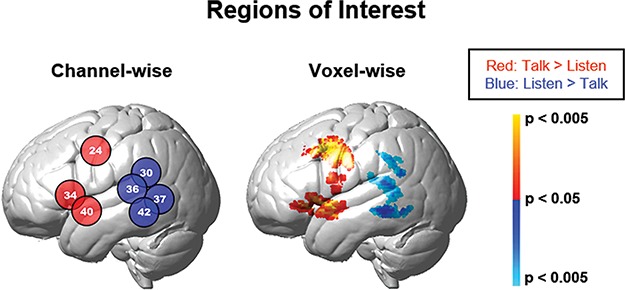
Fig. 2.

Functionally determined ROIs for talking and listening. Monologue and interactive conditions are combined to isolate brain regions associated with talking (talk > listen), red/yellow colors, and listening (listen > talk), blue colors. Findings are presented on the left hemisphere showing two computational approaches: channel-wise (left panel, Table 1, P < 0.05) and voxel-wise (right panel, Table 2. See color bar on right). Group deOxyHb signals (n = 58).
