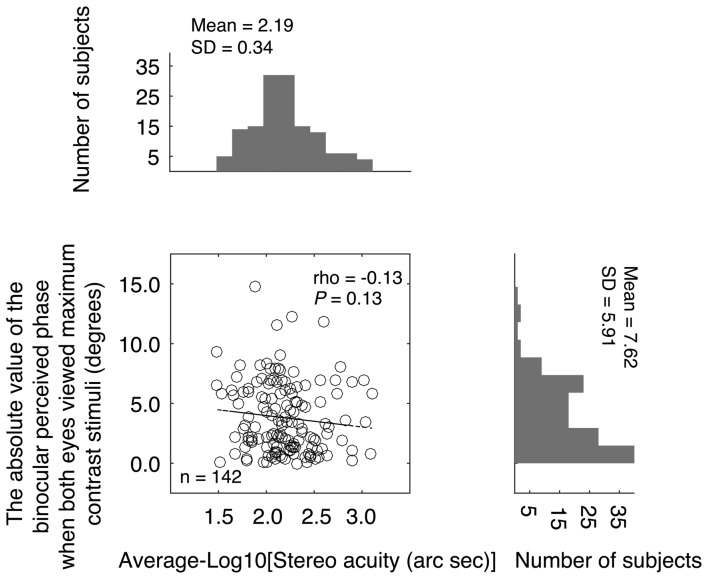
Figure 4.
Relationship between the absolute value of the binocular perceived phase when both eyes viewed maximum contrast stimuli and the stereo acuity. In the scatter plot, each point represents result of one observer; Spearman’s rank correlation coefficient is provided in the figure. The histogram of the absolute value of the binocular perceived phase when both eyes viewed maximum contrast stimuli and the histogram of the stereo acuity are also provided.

