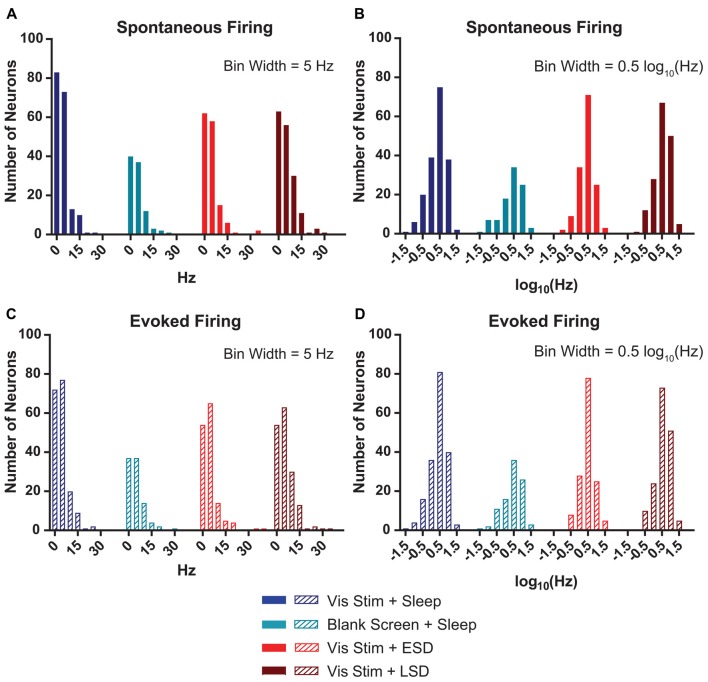
Figure 3.
V1 neurons’ spontaneous and evoked firing rates follow a log-normal distribution. (A) Distributions of baseline (AM) spontaneous firing rates of the neurons recorded from each of the treatment groups were non-normal (p < 0.0001, D’Agostino-Pearson normality test). (B) log(10)-transformed spontaneous firing rates’ distributions approximated normality (p = 0.002, 0.004, 0.15 and 0.02, respectively, for Vis Stim + Sleep, Blank Screen + Sleep, Vis Stim + ESD and Vis Stim + LSD, D’Agostino-Pearson normality test). (C) Distributions of baseline (AM) maximal evoked firing rates (i.e., for each neuron’s preferred-orientation stimulus) of the neurons recorded from each of the treatment groups were non-normal (p < 0.0001, D’Agostino-Pearson normality test). (D) log(10)-transformed evoked firing rate data approximated normality (p = 0.001, 0.02, 0.55 and 0.05, respectively, for Vis Stim + Sleep, Blank Screen + Sleep, Vis Stim + ESD and Vis Stim + LSD, D’Agostino-Pearson normality test).

