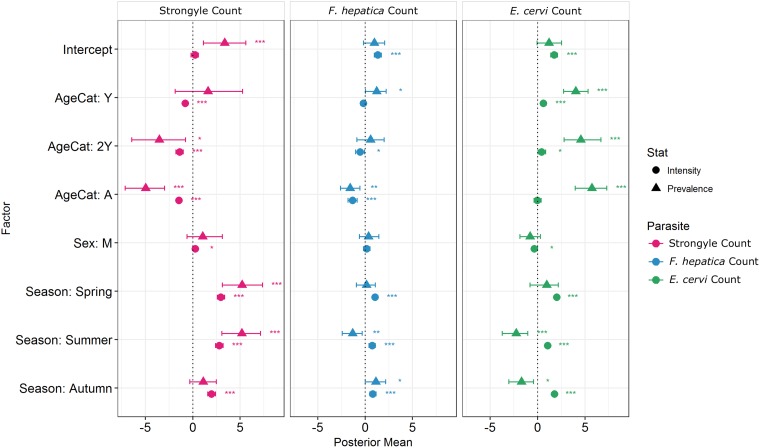
Fig. 4.
MCMCglmm zero-inflated Poisson model output for each of the three analysed parasite taxa. Points represent posterior estimates for mean effect sizes; error bars represent the 95% credibility intervals of the mean. Symbol corresponds to the statistic being estimated – zero-inflation (prevalence) or Poisson (intensity). Zero-inflation coefficients have been multiplied by −1 to aid interpretation; that is, a positive value represents a decrease in zero-inflation and therefore an increase in prevalence.

