Fig. 1.
Functional gene modules detected by co-expression network analysis
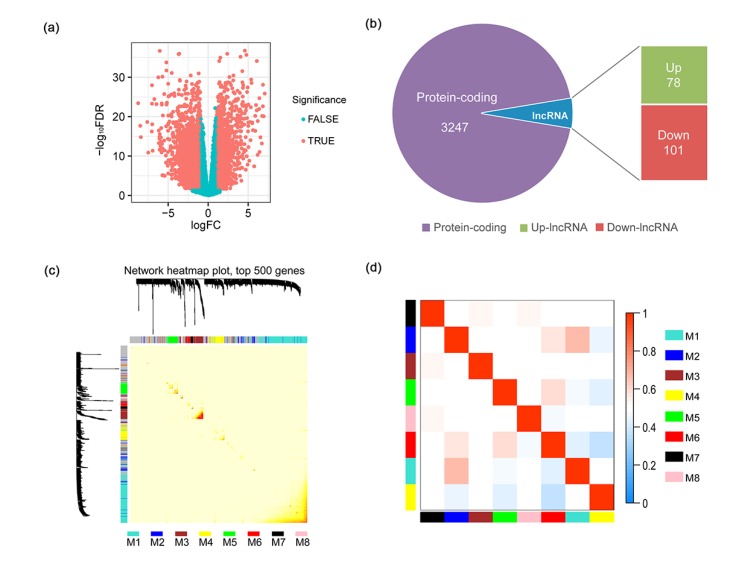
(a) The volcano plot shows the magnitude of differential expression between cancer tissue and its adjacent normal tissue. Each dot represents one gene, and genes in read are significantly altered. FDR: false discovery rate; logFC: log2 fold change. (b) Pie chart shows the proportion of dysregulated lncRNAs in all differentially expressed genes. (c) Topological overlap heatmap of the gene co-expression network. Each row and column represents a gene. Light color indicates low topological overlap, and on the contrary dark color denotes high topological overlap. The different side colors indicate different modules. The dendrogram suggests the clustering of these genes based on the similarity of their gene expression profiles. (d) The correlation between each module demonstrated based on eigengene. Blue represents a negative correlation, while red represents a positive correlation (Note: for interpretation of the references to color in this figure legend, the reader is referred to the web version of this article)

