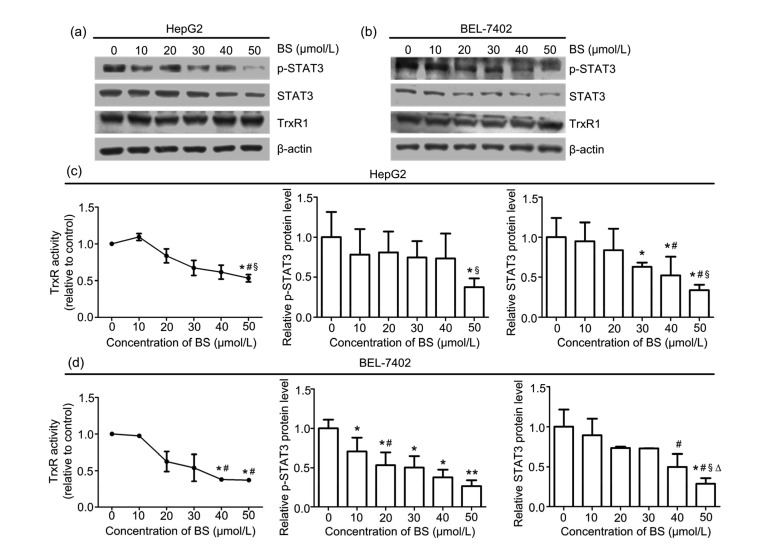
Fig. 2.
Expression of TrxR1, p-STAT3, STAT3, and β-actin protein levels, and TrxR activity after BS treatment for 48 h
Western blot analyses of TrxR1, p-STAT3, STAT3, and β-actin protein levels in HepG2 (a) and BEL-7402 (b) cells. BS decreased the intracellular TrxR activity and p-STAT3 and STAT3 protein levels in HepG2 (c) and BEL-7402 (d) cells. Values are represented as the mean±SD (n≥3). * P<0.05, ** P<0.01 vs. control; # P<0.05 vs. 10 μmol/L BS; Δ P<0.05 vs. 20 μmol/L BS; § P<0.05 vs. 30 μmol/L BS

