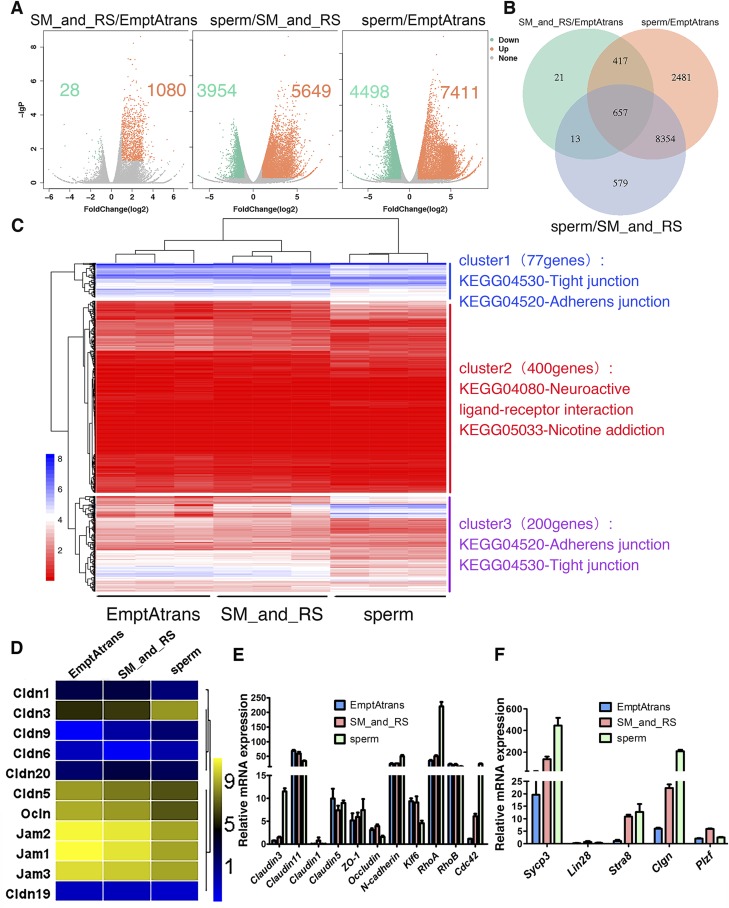
Figure 6.
Transcriptome profiles of seminiferous tubules at different stages of spermatogenesis. A) Scatterplot analysis for differential gene expression in pairwise comparison. B) Venn diagrams showing distribution of significant changed genes in 3 compared groups. C) Heat map of differentially expressed 677 genes that match GO cellular component subterm cell junction, combined with KEGG pathway analysis. D) Heat map analysis of all detected integral membrane proteins’ genes (from Fig. 4C) that are involved in TJ formation. Only Cldn3 showed considerable increase in expression. E, F) Validation of RNA-Seq results and sampling method by real-time reverse transcription–PCR. DEGs in E were enriched genes in KEGG pathway TJs, and Sycp3, Lin28, Stra8, Clgn, and PLZF are well known for their roles in spermatogenesis. Expression profiles of these genes confirmed RNA-Seq results and sampling method. All experiments were results of 3–4 independent experiments or 3–4 mouse testes.

