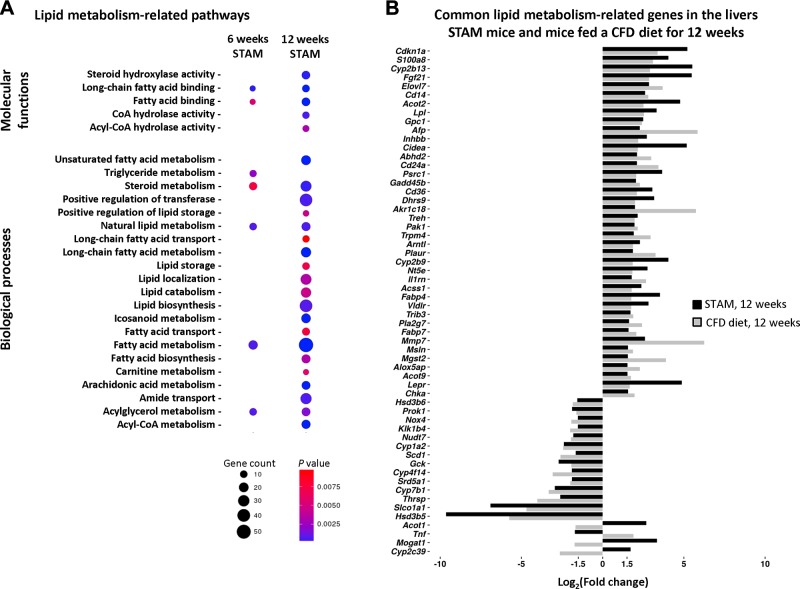
Figure 1.
Expression of lipid metabolism–related genes in the livers of STAM mice and mice fed a CFD diet, as determined by whole-genome microarrays. A) Gene enrichment of lipid metabolism pathways in STAM mice at 6 and 12 wk. The size and color of the circles indicate the number of genes and their significance. B) Common differentially expressed lipid metabolism–related genes in the livers of STAM mice and mice fed a CFD diet for 12 wk.

