
Figure 1. Infant Gut Microbiota at 3 to 4 Months According to Breastfeeding (BF) Status.
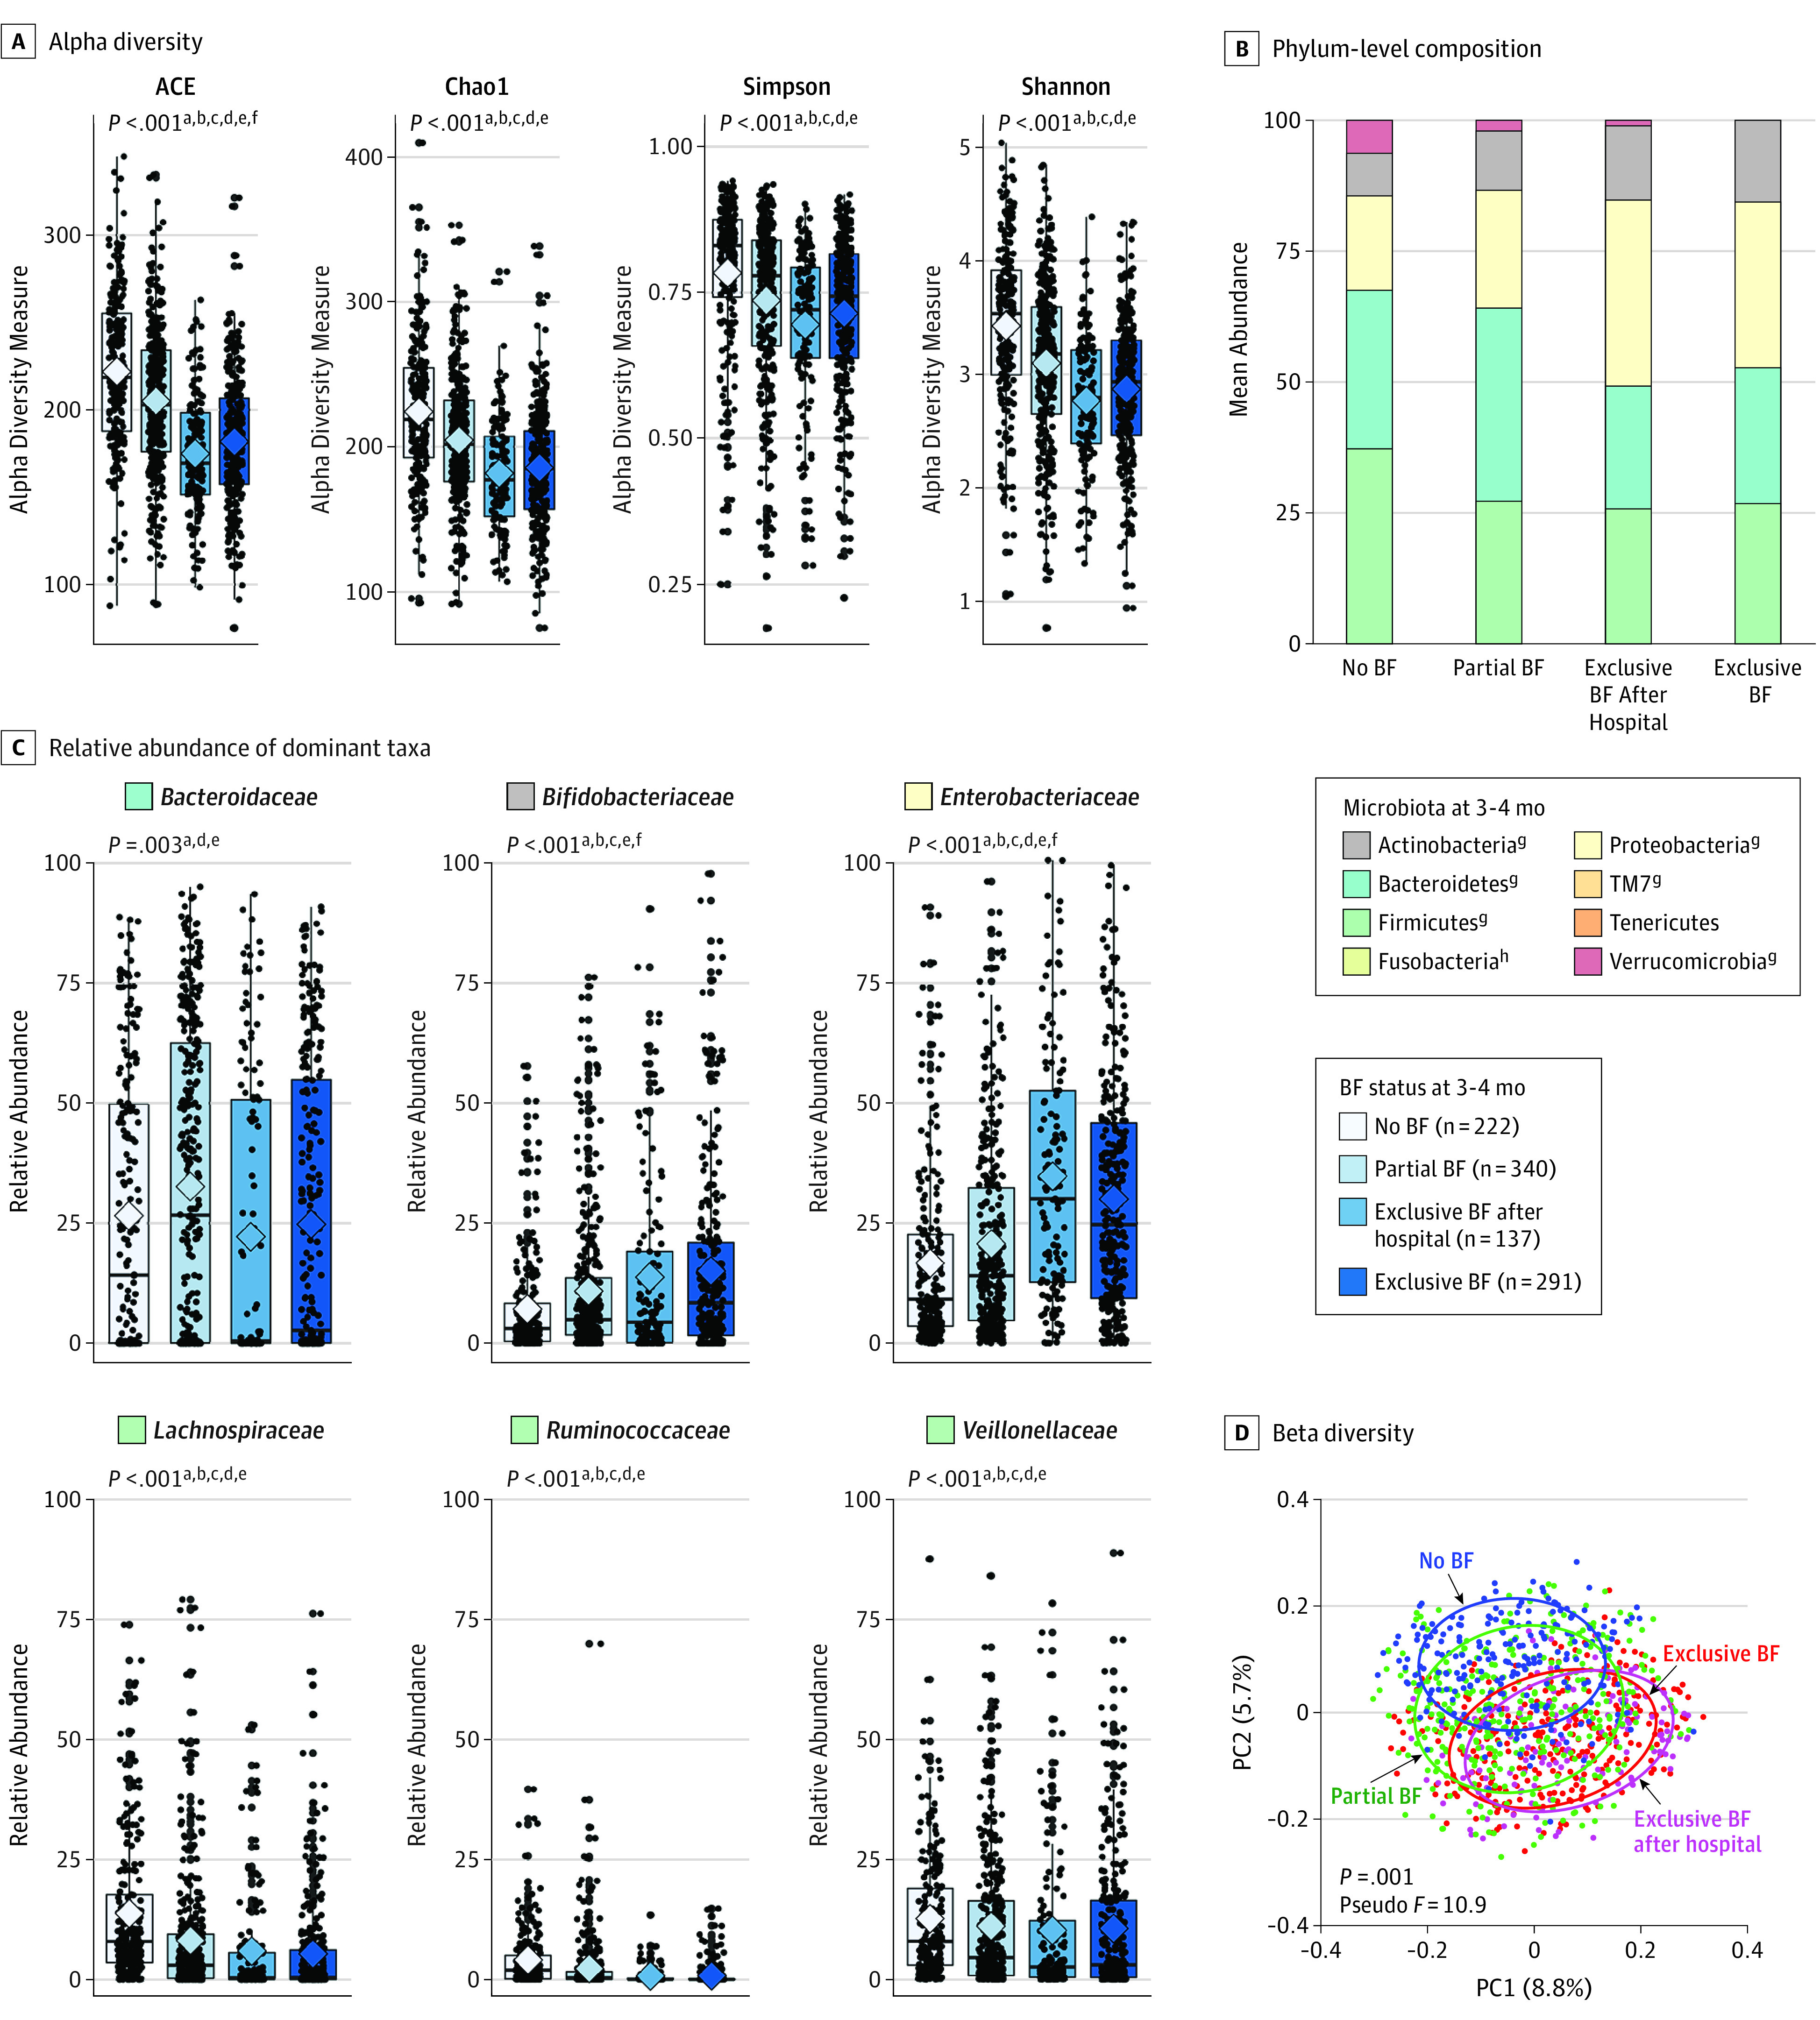
A, Alpha diversity evaluated by richness (abundance-based coverage estimator [ACE] and Chao1) and diversity (Simpson and Shannon). Median estimates are compared across feeding groups using the Kruskal-Wallis test (nonparametric analysis of variance) and Dunn post hoc tests for multiple comparisons. Boxes indicate interquartile range, lines indicate medians, diamonds indicate means, and whiskers represent range. B, Mean phylum-level composition. C, Relative abundance of dominant taxa across feeding groups. Breastfeeding (BF) status is assessed at the time of sample collection. Breastfeeding refers to breast milk feeding regardless of feeding mode (at the breast or from a bottle). D, Principal coordinate analysis (PC1 and PC2) based on unweighted UniFrac distances, with community structure differences tested by permutational analysis of variance with 999 permuations.
P values represent false discovery rate–corrected P values testing for overall differences across the 4 feeding groups. Significant pairwise comparisons:
aNo BF/partial BF;
bNo BF/exclusive BF after hospital;
cNo BF/exclusive BF;
dPartial BF/exclusive BF after hospital;
ePartial BF/exclusive BF;
fExclusive BF after hospital/exclusive BF.
gP < .001.
hP < .05.