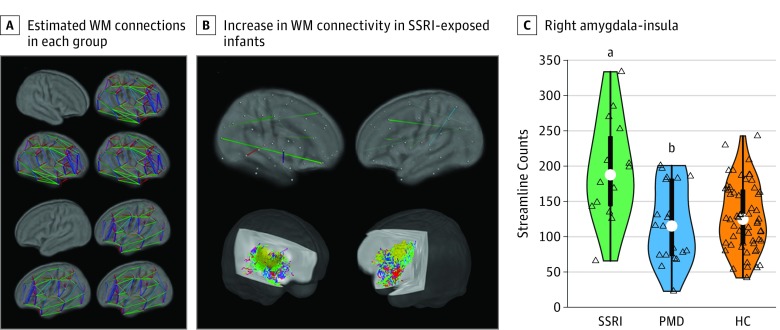
Figure 2. White Matter (WM) Structural Connections in Infants With Prenatal Exposure to Selective Serotonin Reuptake Inhibitors (SSRIs).
A, White matter structural connectomes (90 regions) estimated using diffusion tractography; across both hemispheres, similar connectome organization was evident in each study group: healthy control (HC) infants, SSRI-exposed infants, and prenatal maternal depression (PMD)-exposed infants without SSRI exposure (permutation tests against 1000 randomized connections; P < .05; SSRI, n = 14; PMD, n = 20; HC, n = 58). B, Upper row shows a map of significant group differences in WM connectivity. Regression analyses were conducted on the connectivity matrix using a whole-brain-corrected P < .05 (randomization permutation; false discovery rate control). Lower row shows a representative WM pathway connecting the right amygdala (red) and the right insula (yellow) color-coded by direction. C, Distributions (colored area), quartiles (thick bar), 95% CIs (thin line), and medians (white dots). Open triangles represent infants. The significance of the group differences was based on a regression model performed on the right amygdala-right amygdala connectivity (exhaustive permutations).
aP < .001 compared with the PMD group, P < .001 compared with the HC group, and P = .001 compared with the PMD and HC groups combined.
bP = .80 compared with the HC group.

