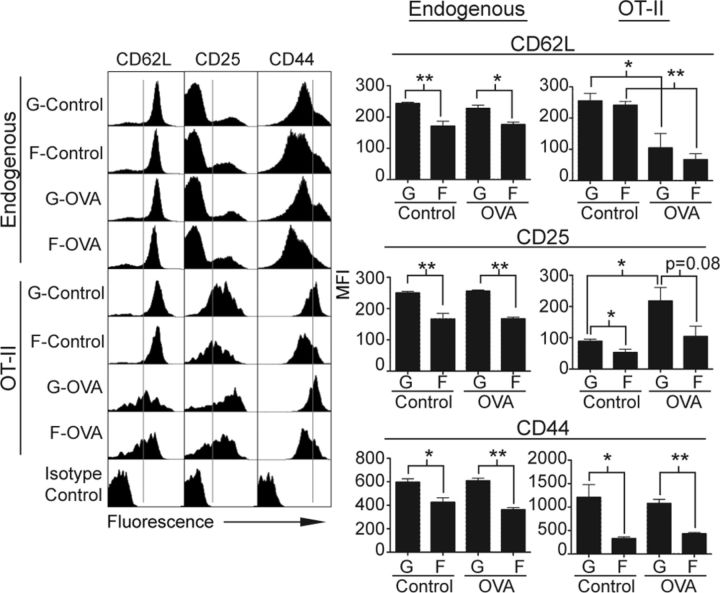
Figure 4.
Expression of CD62L, CD25, and CD44 on endogenous and transferred CD4 T cells from flight and ground mice differed. Draining lymph nodes were collected and single cell suspensions stained with CD4, CD45.2, and 1 of indicated T-cell markers or its corresponding isotype control. Endogenous CD4 T cells were identified as CD45.2−CD4+ cells, and transferred OT-II T cells were identified as CD45.2+CD4+ cells. FACS histograms show expression profile of CD62L, CD25, or CD44 on endogenous or OT-II cells of 1 representative mouse per group. Gray lines within histograms show gating between cells expressing high vs. low levels of indicated surface marker. Bar graphs show MFI for each T-cell marker averaged across all mice for entire experimental group (n = 4, except flight control n = 3). MFI of surface markers was calculated for entire indicated T-cell population (endogenous or OT-II), except for CD25 on endogenous cells, which represent MFI of gated CD25hi population. G, ground; F, flight. *P < 0.05 and **P < 0.005 (2-tailed Student’s t test). Error bars represent se.

