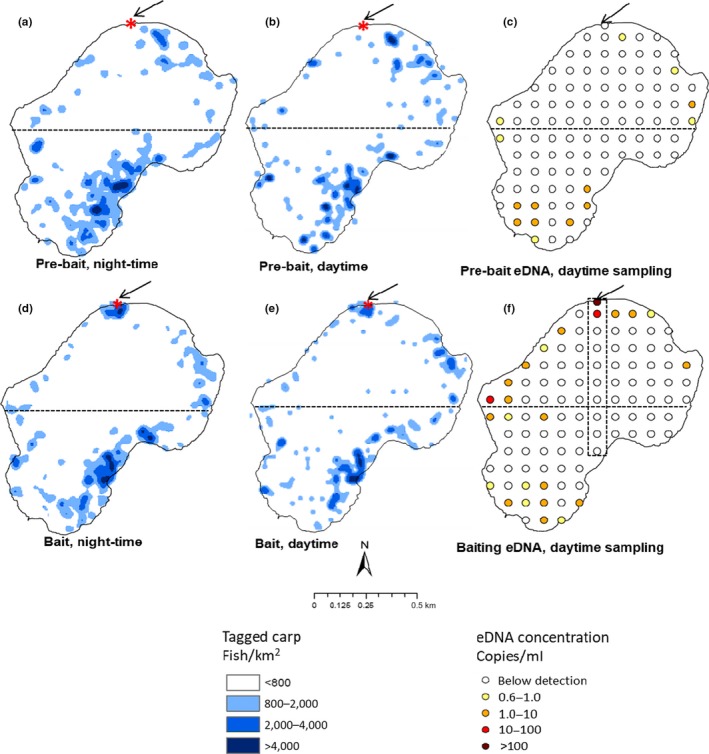
Figure 2.

Map of Lake Steiger showing the distribution of radio‐tagged Carp and eDNA levels during the prebaiting and baiting phases. Panels (a, d) are kernel plots showing the distribution of radio‐tagged Carp during the nighttime (averaged over 7 nights) with panels (b, e) showing daytime values (averaged over 7 days) for the prebaiting and baiting phases. Panels (c) and (f) show the eDNA levels measured at each sample site the morning after the prebaiting and the baiting phases. The asterisk (*) and arrow identifies the bait site. The dotted line shows the northern and southern halves of the lake while the dotted rectangular box represents the sampling transect used at the end of the experiment
