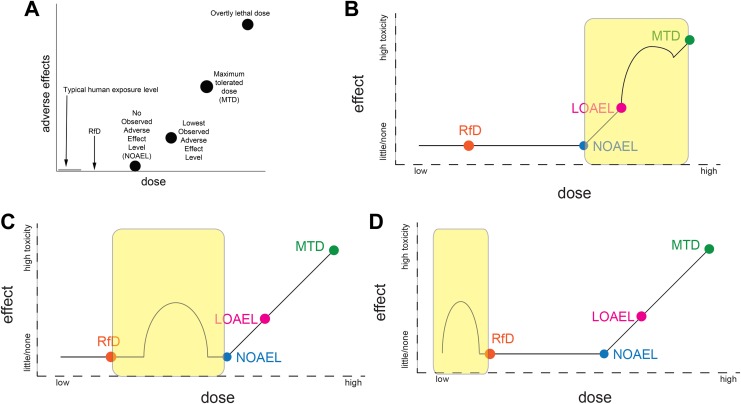
Figure 1.
Examples illustrating nonmonotonic dose–response curves (NMDRCs) at different portions of the dose–response curve relative to the no observed adverse effect level (NOAEL) and reference dose (RfD). A, Circles indicate doses typically examined in conventional toxicity tests, which are used to calculate the RfD. This figure shows the expected relationship between human exposure levels, the RfD, and the NOAEL; no adverse effects are expected at human exposure levels, the RfD, or the NOAEL, if the NOAEL is a “true” threshold for adverse effects. B, Case 1, where nonmonotonicity is observed above the NOAEL. C, Case 2, where nonmonotonicity occurs at exposures between the RfD and the NOAEL. D, Case 3, where nonmonotonicity occurs at exposures below the RfD.

