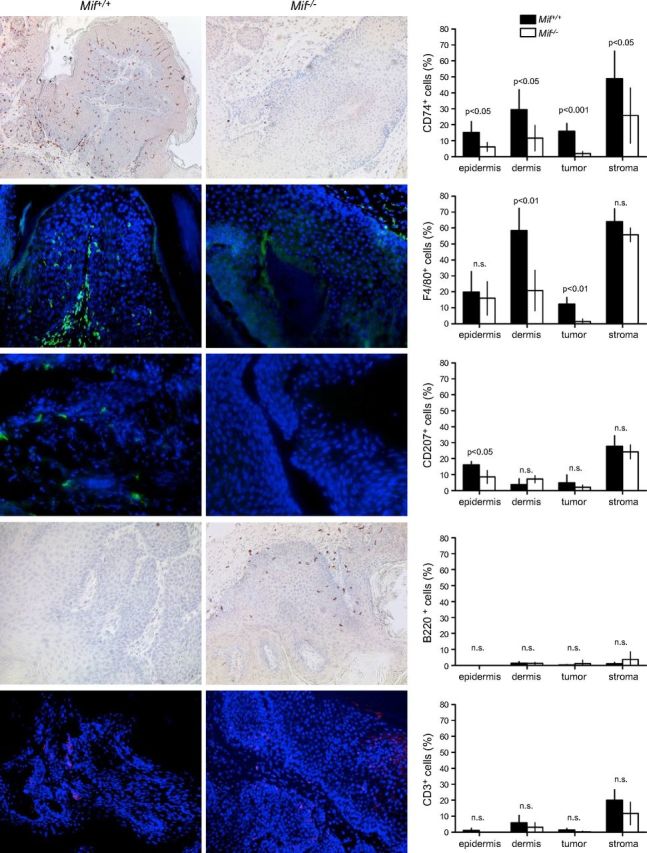
Figure 4.

IHC analysis of immune cell infiltrates in DMBA/TPA-treated murine skin and DMBA/TPA-induced murine keratosis and corresponding statistics for each marker (right). Pictures of Mif+/+ control mouse tissues (left). Pictures of Mif−/− mice (middle). Original magnification, ×100. Epidermis, DMBA/TPA-treated, but nontumor-bearing epidermis; dermis, DMBA/TPA-treated, but nontumor-bearing dermis; tumor, epithelial part of the DMBA/TPA-induced keratosis; stroma, stromal part of the DMBA/TPA-induced keratosis. Mif+/+ indicated by solid bars; Mif−/− indicated by open bars. Percentage of positive cells was calculated by number of positive cells divided by total number of cells. For every tumor and tissue, total available cells were counted. HF, hair follicle; n.s., not significant.
