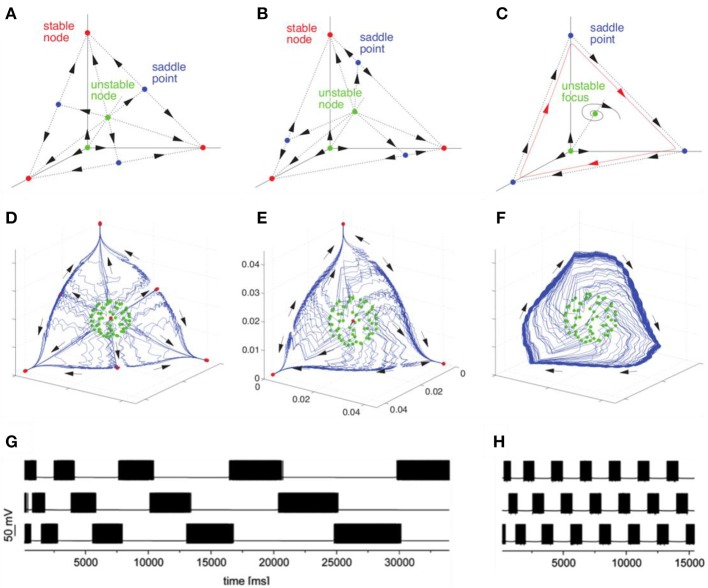
Figure 2.
Transition from multistability to WLC dynamics in models with different time scales with connection asymmetry as the control parameter. The figure illustrates the bifurcation toward the birth of a heteroclinic cycle in a Lotka–Volterra model (A–C) and in a H–H model (D–H). (A,D) represent multistable dynamics (stable fixed points indicated in red correspond to the attractors). (B) and (E) represent an intermediate case before the annihilation of the stable fixed points (saddles are indicated in blue). (C,F) represent the heteroclinic cycle that emerges after the saddle node bifurcation. (G,H) represent the time series corresponding to transient heteroclinic dynamics and a robust heteroclinic cycle in the H-H model. Adapted from Nowotny and Rabinovich (2007), Rabinovich and Varona (2011).

