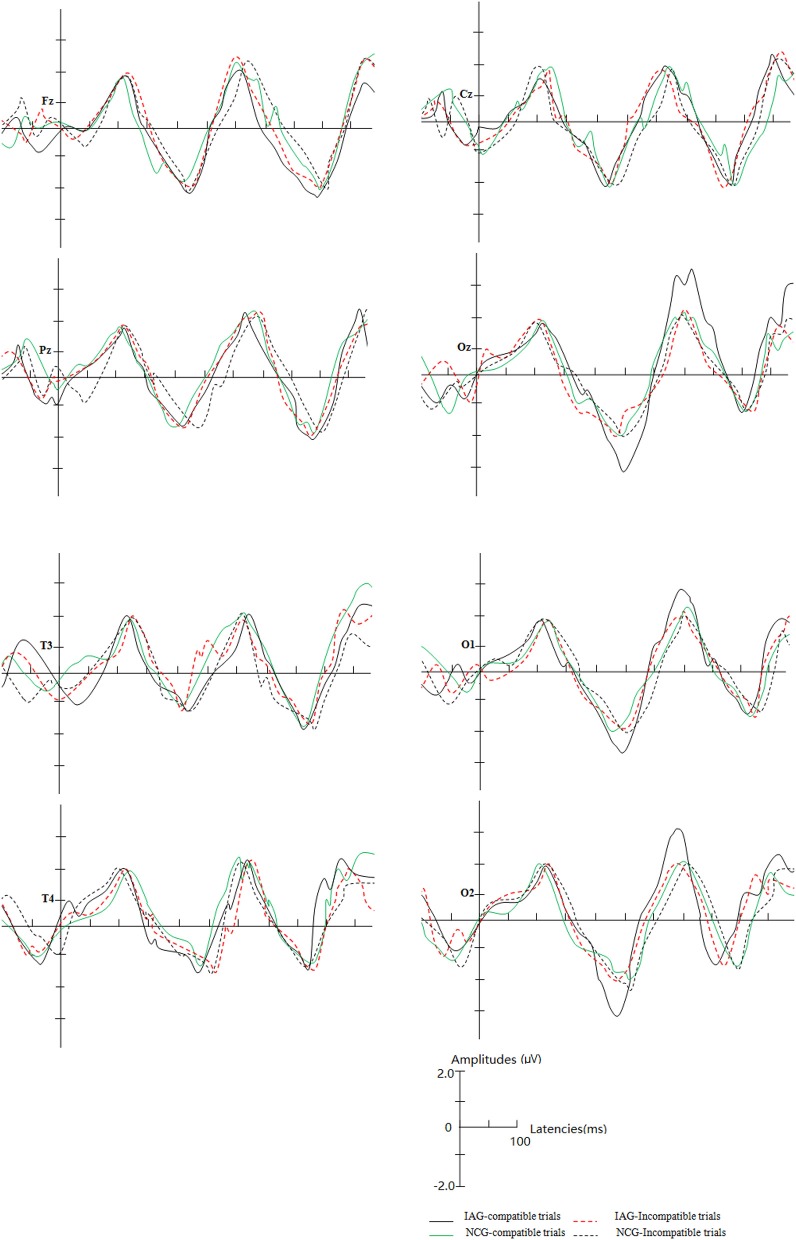
Figure 6.
The sketch map of grand average waveforms elicited by IAG-compatible trial stimuli, IAG-incompatible trial stimuli, NCG-compatible trial stimuli, and NCG-incompatible trial stimuli at Fz, Cz, Pz, T3, T4, Oz, O1, and O2. In IAG, at the Oz, O1, and O2 sites, the positive implicit associations with Internet-related cues elicited larger N2 and P3 amplitudes.

