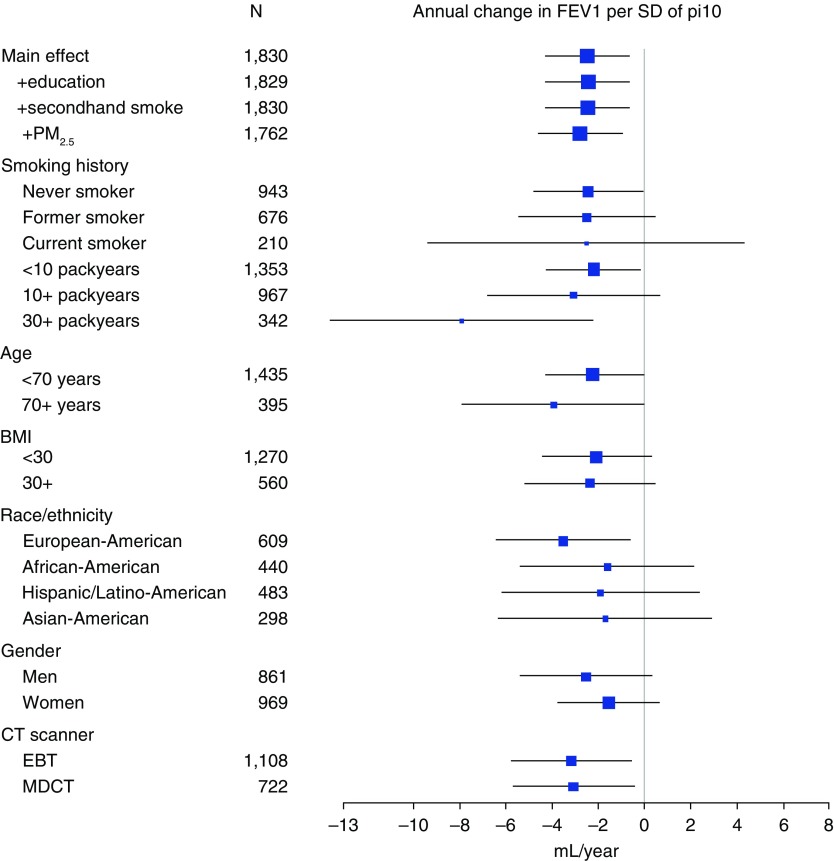
Figure 2.
Stratified associations between average wall thickness for a hypothetical airway of 10-mm lumen perimeter on computed tomography (Pi10) and annual change in forced expiratory volume in 1 second (FEV1) over five years of follow-up, with 95% confidence intervals, in participants without initial airflow limitation or prevalent clinical chronic lower respiratory disease. Fully adjusted models include age, sex, race/ethnicity, body mass index (BMI), smoking status, pack-years, percent emphysema, voxel size, and computed tomography (CT) scanner type. EBT = electron beam computed tomography; MDCT = multidetector computed tomography; PM2.5 = particulate matter less than or equal to 2.5 μm in aerodynamic diameter; SD = standard deviation.

