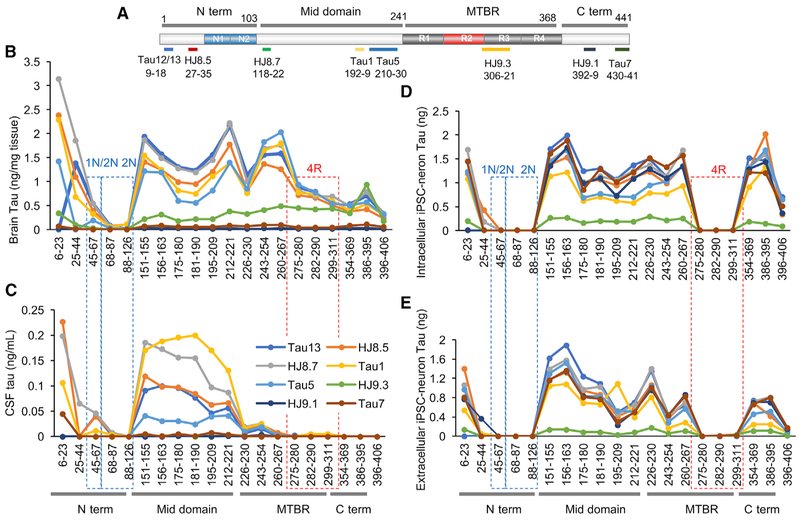
Figure 1. Tau Profiles in the Human CNS and Neurons.
(A)Schematic of the longest tau isoform (2N4R), fragments detected by MS, and epitopes of tau antibodies.
(B–E) Quantitation of tau peptides in the human brain (B), normal control CSF (C), cell lysates (D), and media (E) from iPSC-derived neurons. Brain tau (B) and cellular tau (D) are a mixture of full-length and C-terminally truncated tau. CSF tau (C) is truncated at the end of the mid-domain (between amino acids 222 and 225). Extracellular tau from iPSC-derived neurons (E) is primarily C-terminally truncated. Intracellular tau from iPSC-derived neurons was diluted to match extracellular tau level. Red dashed lines indicate 4R-containing peptides in the microtubule-binding region (MTBR). Blue dashed lines indicate 1N- and 2N-containing peptides.
Data are represented as mean ± SD. See also Figures S1–S3.

