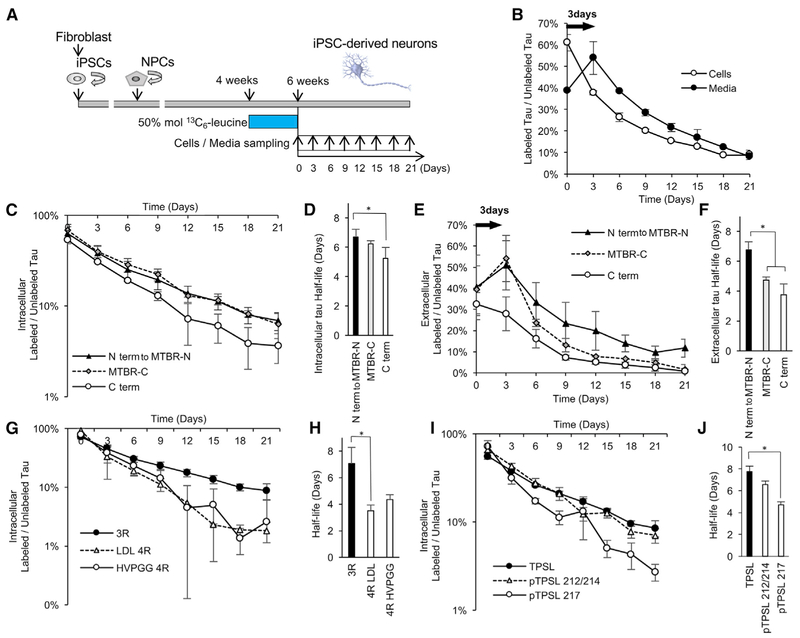
Figure 2. Differential Tau Kinetics of Tau Isoforms in iPSC-Derived Neurons.
(A) A diagram illustrating the in vitro tau SILK protocol. iPSCs were converted into neural precursor cells (NPCs) and differentiated into iPSC-derived neurons for 4 weeks. iPSC-derived neurons were pre-labeled with 50 mol % (100% TTR) 13C6-leucine for 2 weeks from week 4 to 6 (pulse). iPSC-derived neurons were cultured in label-free media for 21 days (chase). Cells and media were collected every 3 days.
(B) Kinetic profiles of tau (TPSLPTPPTR) peptides in the cells and in the media. There is a 3-day delay in the newly translated tau released from the intracellular to extracellular space.
(C) Kinetic profiles of intracellular peptides.
(D) C terminus (C term) peptides have faster turnover and significantly shorter half-lives (p = 0.0003; F = 9.48; Df = 39).
(E) Kinetic profiles of extracellular peptides. N terminus, mid-domain, and N terminus of microtubule-binding region (N term to MTBR-N) peptides have similar kinetic profiles. Full-length tau containing C terminus (C term) does not have a 3-day time delay and has a similar kinetic profile as intracellular full-length tau. C terminus of microtubule-binding region (MTBR-C) is released with 3-day time delay and has a shorter half-life than N term to MTBR-N tau (p < 0.0001; F = 18.28; Df = 30).
(F) MTBR-C and C term tau peptides have significantly shorter half-lives than N term to MTBR-N tau (p = 0.0033; F = 18.28, Df = 30).
(G and H) 4R tau isoform-specific peptides (LDL and HVPGG; see Table 1 for abbreviations) have faster turnover and shorter half-lives in the cell lysates compared to the 3R (p = 0.0007; F = 5.455; Df = 29).
(I and J) Phosphorylated tau at T217 (pTPSL 217) has a faster turnover and shorter half-life compared to unphosphorylated tau in the cell lysate (p = 0.0057; F = 8.5; Df = 10). Significance was determined via one-way ANOVA with Tukey’s post hoc test. *p % 0.05.
Data are represented as mean ± SD. See also Tables 1 and 2 and Figures S4 and S5.

