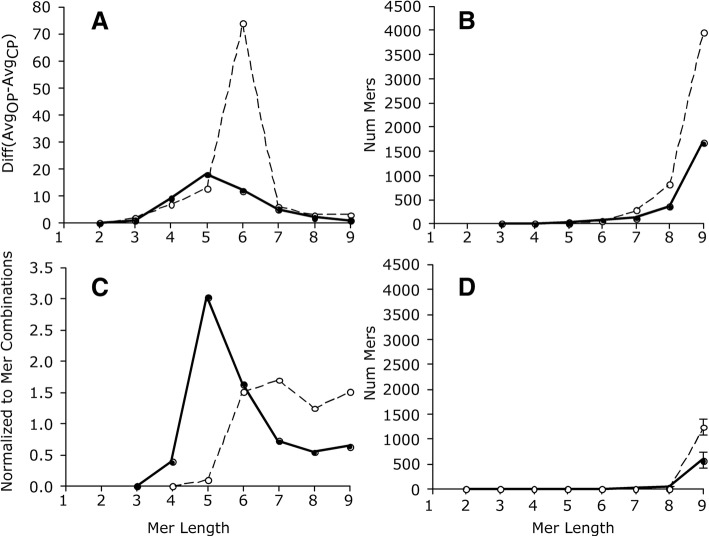
Fig. 2.
Mer counts as a function of mer length. Hatched line, mouse; solid line, zebrafish. Panel a, Difference in average mer counts by group (OP vs. CP); Panel b, individual mer counts that were 5 time stdev of average of the CP; Panel c, is the same results as panel B except normalized to the number of possible mer combinations and shown as a percentage; Panel d, number of mer counts that were 5 times stdev of the average CP due to random chance; average ± stdev of 3 random selections (without replacement)

