Fig. 6.

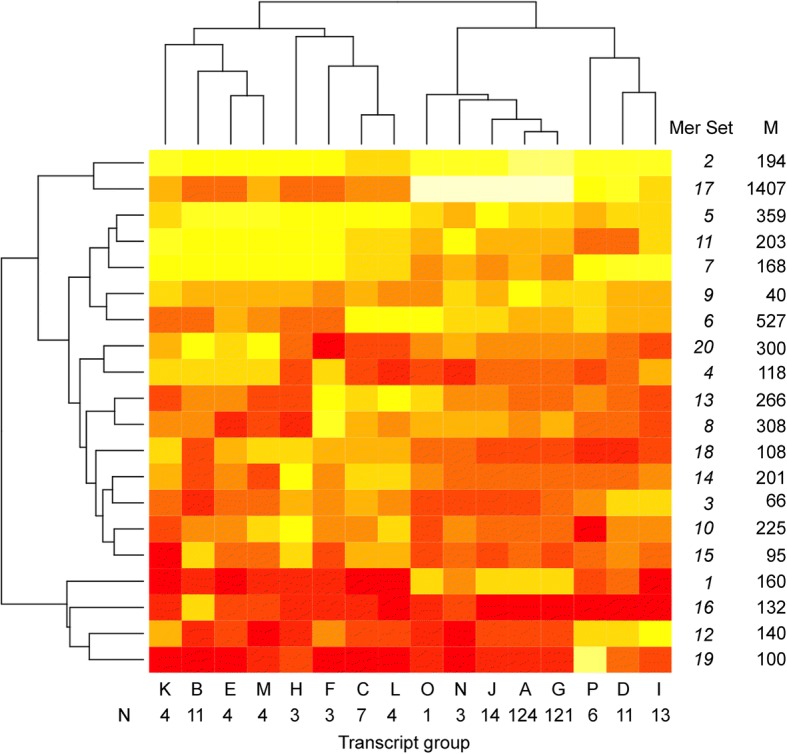
Heatmap of Transcript groups and mer sets for the mouse. M, count of mers in group; N, count of transcripts in group. White, high count; yellow-orange, median count; red, low count

Heatmap of Transcript groups and mer sets for the mouse. M, count of mers in group; N, count of transcripts in group. White, high count; yellow-orange, median count; red, low count