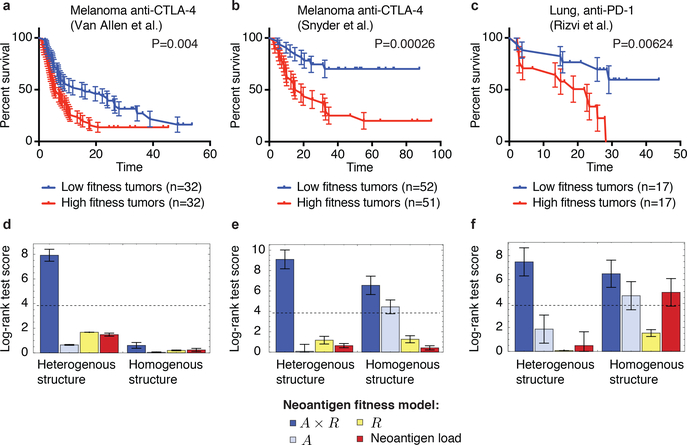
Figure 2 |. Neoantigen fitness model is predictive of survival after checkpoint blockade immunotherapy.
a-c, Tumor fitness is calculated across two melanoma cohorts treated with anti-CTLA-44,5 and one lung cancer cohort treated with anti-PD-16. Kaplan-Meier curves of overall survival are displayed for each, with samples split by the median value of their tumor’s relative population size (𝜏) (equation (1)). Error bars represent standard error due to sample size (SI). The p-values from log-rank tests comparing the two KM curves are shown above each plot. d-f, Log-rank test score for the full neoantigen fitness model (navy blue), for partial models accounting for a single feature of the full model (light blue and yellow) and for the neoantigen load model (red). All models are evaluated both over a tumor’s clonal structure (heterogenous, left) and without clonality (homogenous, right). All model scores are presented for parameters obtained on independent training data (Methods). Error bars are the standard deviation of the log-rank test score acquired from survival analysis with one sample removed at a time (d, n=64, e, n=103, f, n=34). Dashed lines correspond to 5% significance.

