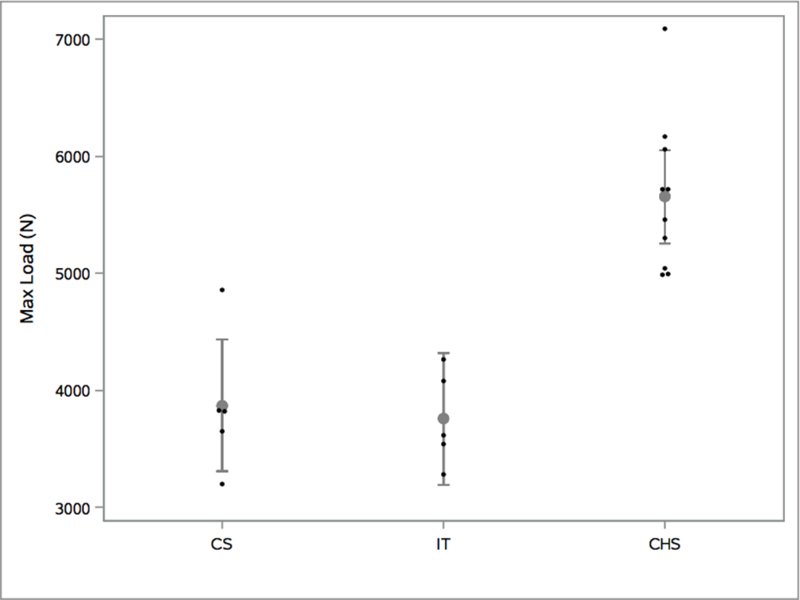
Fig 3.

The max failure load of each group. The y-axis is the load to failure in N. The cannulated groups were not significantly different from each other (p=0.7669). The CHS group had a higher maximum load to failure than both cannulated groups (CHS vs CS p<0.0001; CHS vs IT p< .0001).
