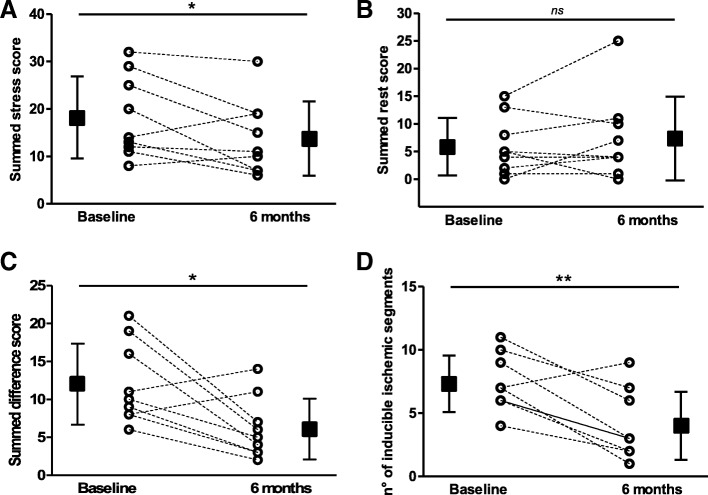
Fig. 3.
Myocardial perfusion at SPECT after 6-month follow-up. Changes of a summed stress score, b summed rest score, c summed difference score and d number of segments with inducible ischemia per patient. Square data markers with error bars represent mean ± SD of each SPECT parameter at baseline and 6 months (n = 9). *p ≤ 0.05, **p ≤ 0.01, ns = not significant

