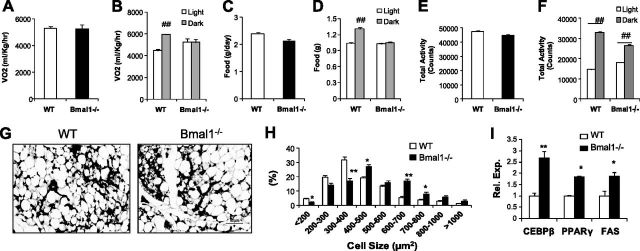
Figure 2.
CLAMS analysis and adipose development in 7-d-old neonates. A–F) Total (A, C, E) and light vs. dark cycle (B, D, F) oxygen consumption (A, B), food intake (C, D) and activity level (E, F) in WT and Bmal1−/− mice fed a chow diet (n=5–6/group). ##P < 0.01 vs. light cycle. G–I) Histology (G), quantification of adipocyte cell size distribution (H), and gene expression analysis (I) of subcutaneous white adipose tissue (n=4–5) in 7-d-old neonates. Adipocyte cell size was quantified from 3 representative fields (×200) from each mouse. *P < 0.05, **P < 0.01 vs. WT.

