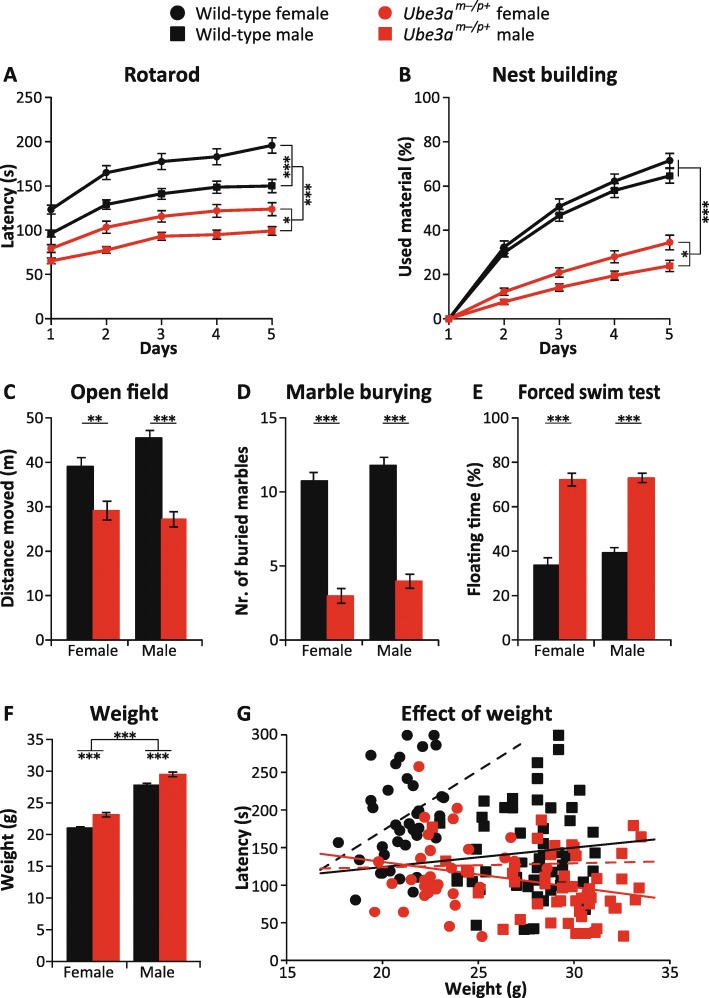
Fig. 2.
Effect of sex on the behavioral phenotypes of Ube3atm1Alb mice in F1 hybrid 129S2-C57BL/6J background. a Accelerating rotarod in WT and Ube3am−/p+ female mice (n = 52, 46) and in WT and Ube3am−/p+ male mice (n = 68, 65). b Nest building test in WT and Ube3am−/p+ female mice (n = 42, 33) and in WT and Ube3am−/p+ male mice (n = 52, 53). c Open field test in WT and Ube3am−/p+ female mice (n = 47, 41) and in WT and Ube3am−/p+ male mice (n = 66, 65). d Marble burying test in WT and Ube3am−/p+ female mice (n = 52, 46) and in WT and Ube3am−/p+ male mice (n = 68, 65). e Forced swim test in WT and Ube3am−/p+ female mice (n = 52, 46) and in WT and Ube3am−/p+ male mice (n = 68, 65). f Bodyweight in WT and Ube3am−/p+ female mice (n = 37, 33) and in WT and Ube3am−/p+ male mice (n = 53, 50). g Pearson correlation test between body weight and latency to fall at day 5 in WT and Ube3am−/p+ female mice (n = 37, 33) and in WT and Ube3am−/p+ male mice (n = 53, 50). Multivariate repeated ANOVA or a two-way ANOVA was used for statistical comparison. A Bonferroni’s post hoc test was used to detect significant differences in behavioral phenotypes of male and female groups. All data represent mean ± SEM. Significant effects of genotype or sex are indicated as *p < 0.05, **p < 0.01, and ***p < 0.001

