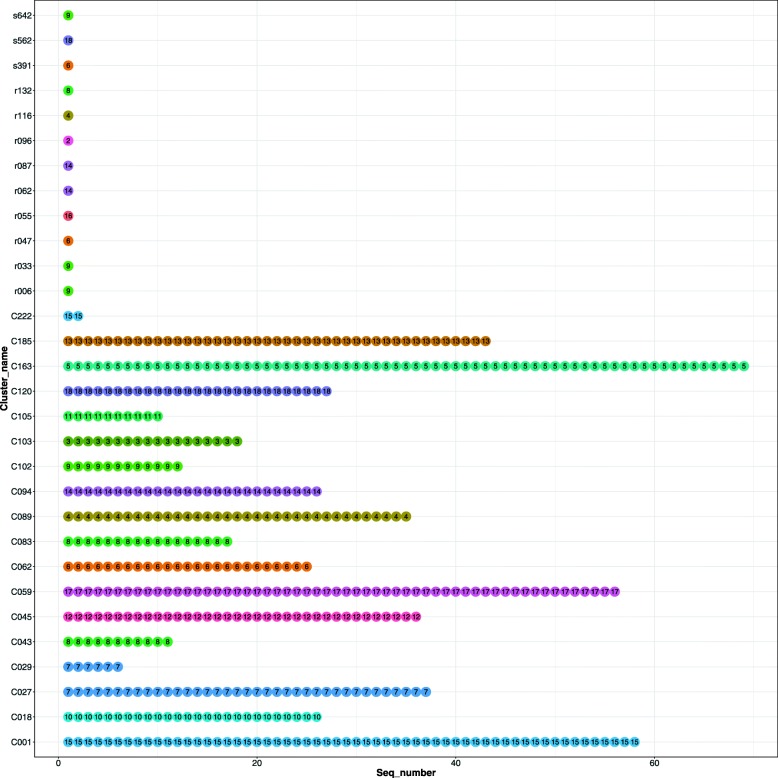
Fig. 3.
Comparison of the DM-PhyClus cluster estimates with a proposed cluster configuration for the real dataset. The coordinates on the vertical axis indicate cluster membership according to [6], and the colour and number of each dot, the cluster membership according to the maximum posterior probability (MAP) estimate of DM-PhyClus

