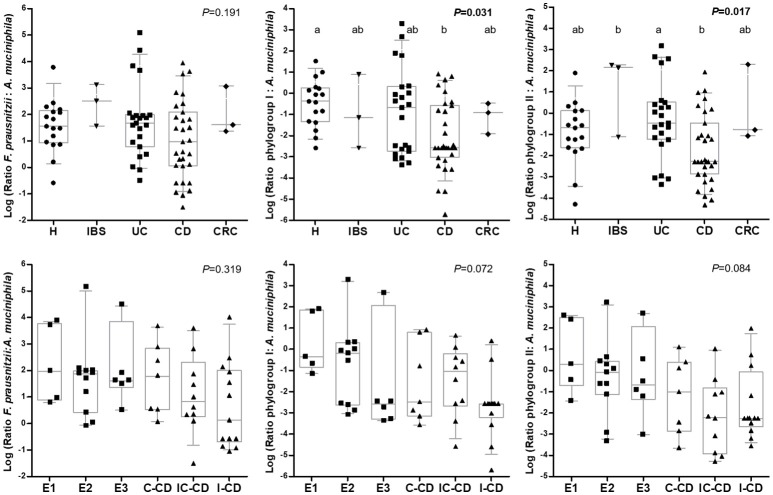
Figure 2.
Box and whiskers plot of the ratio total F. prausnitzii: A. muciniphila, F. prausnitzii phylogroup I: A. muciniphila, and F. prausnitzii phylogroup II: A. muciniphila: (from left to right) by group of subjects (up) and by Inflammatory Bowel Disease subtype (down). Data are represented as log10 of each ratio. The median is represented by the horizontal line in each box. Boxes cover the 25 and 75% quantiles, and bars show the 10 and 90% quantiles. Individual data are also shown. Homogeneous subgroups in each plot are indicated with the same superscript. H, control subjects; IBS, irritable bowel syndrome; UC, ulcerative colitis; CD, Croh's disease; CRC, colorectal cancer; E1, ulcerative proctitis; E2, ulcerative left-sided colitis; E3, ulcerative pancolitis; IC-CD, ileocolonic CD, I-CD, ileal CD; C-CD, colonic CD. A. muciniphila, 16S rRNA gene Akkermansia muciniphila; F. prausnitzii, 16S rRNA gene total Faecalibacterium prausnitzii; Phylogroup I, 16S rRNA gene F. prausnitzii phylogroup I; Phylogroup II, 16S rRNA gene F. prausnitzii phylogroup II.

