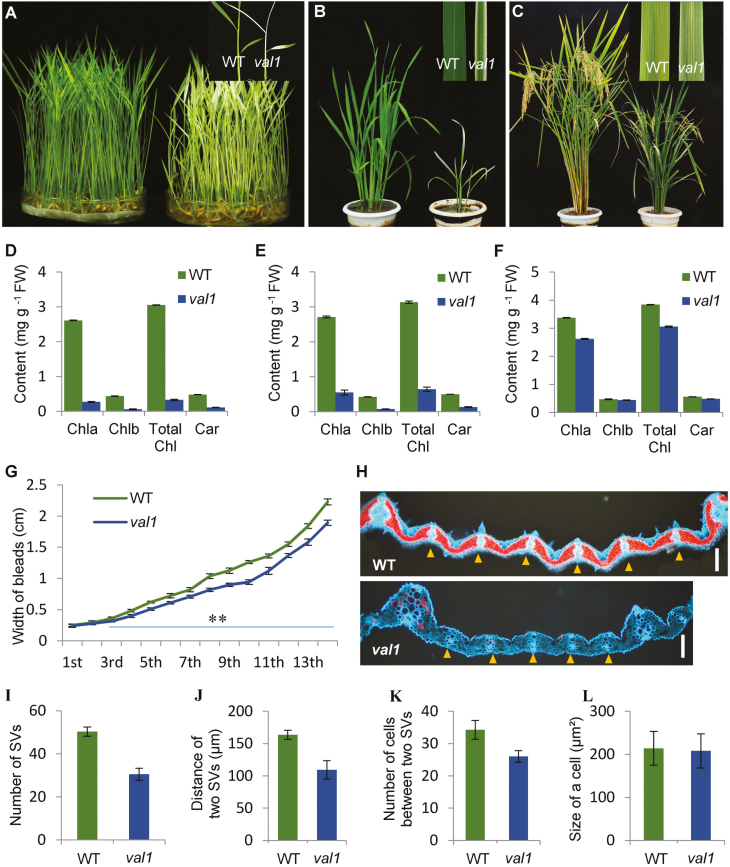
Fig. 1.
Phenotypic characteristics of the wild-type (WT) and the val1 mutant. (A–C) Phenotypes of the WT and val1 at the seedling stage (A), tiller stage (B), and heading stage (C). Close-up images of the leaves of the WT and val1 are shown at top-right. (D–F) Chlorophyll content of the leaves of the WT and val1 at the seedling stage (D), tiller stage (E), and heading stage (F). (G) Leaf blade widths of the WT and val1 plants for the 1st–14th leaves produced across the total growth period. (H) Transverse sections of the seventh leaf blade of the WT and val1. Yellow triangles indicate small vascular bundles. Scale bars are 100 µm. (I–L) Comparisons of the number of small vascular bundles (SV) (I), the distance between the small vascular bundles (J), and the number of cells (K) and the size of cells (L) between the small vascular bundles in the WT and val1. Data are means (±SD) of three biological replicates.

