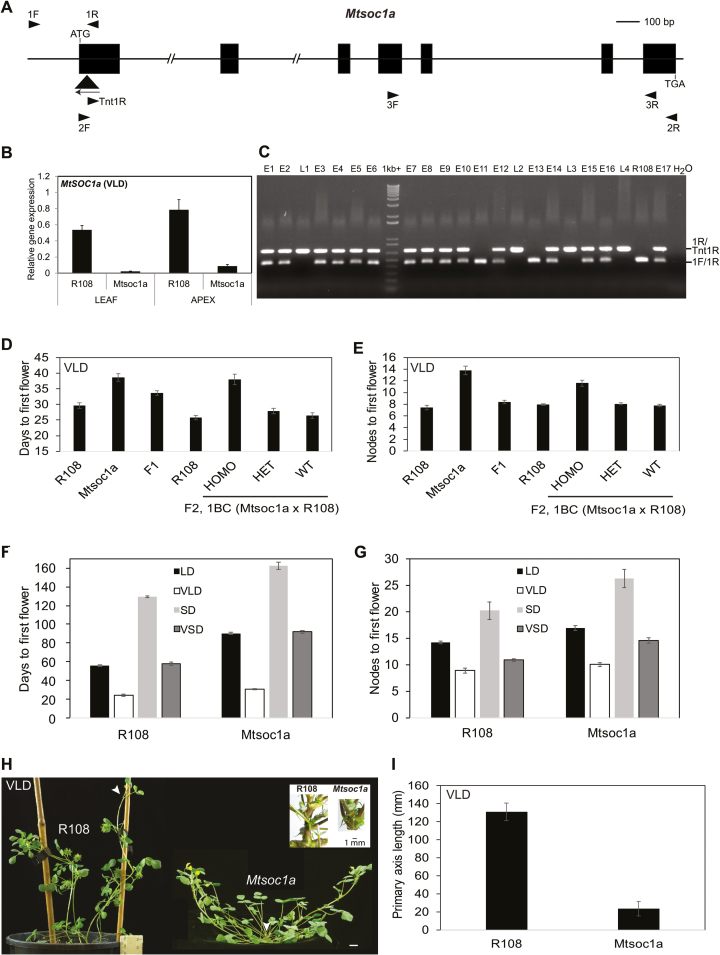
Fig. 4.
Mtsoc1a mutants have a recessive late flowering phenotype and reduced elongation of the primary stem. (A) Diagram of the MtSOC1a gene with the Tnt1 insertion (black triangle) in the Mtsoc1a mutant. Exons are the black boxes and introns are thin lines. Arrowheads indicate primers. (B) Relative expression of MtSOC1a in 14-day-old R108 and Mtsoc1a seedlings in VLDs. Gene expression was determined using RT–qPCR with 3F and 3R primers, and the data are the mean ±SE of three biological replicates, normalized to Medicago PP2A. Data are presented relative to the highest value. Tissues were harvested 2 h after dawn. (C) Photograph showing PCR genotyping fragments from segregating VLD F2 plants. Plants were scored as early (E) (like R108) or late (L) flowering relative to R108. Three genotyping primers were pooled in the PCR. (D and E) Graphs showing the flowering time in vernalized LDs (VLDs) scored as the number of days to flowering (D) or the number of nodes on the primary axis at flowering (E) of the F1 progeny (n=14) from a backcross of Mtsoc1a mutants to wild-type R108 plants compared with Mtsoc1a mutants (self-cross) (n=10) and R108 plants (n=13), and the segregating F2 progeny from this backcross (n=206: Mtsoc1a Tnt1 homozygotes, n=50; heterozygotes, n=111; wild-type segregants, n=45) with R108 wild-type control plants (n=28). The data are shown as the mean ± (t.SE) (0.05). (F and G) Graphs showing the flowering time in different conditions including short days (SDs) of Mtsoc1a mutants and R108 scored in either days (F) or nodes to first flower (G). The Mtsoc1a plants in LDs and VLDs were F3 plants after a backcross to R108. The mean ± (t.SE) (0.05) is presented (n=6–50). (H) Photographs of R108 wild-type plants with seed barrels and a prostrate, late flowering Mtsoc1a F2 homozygote with a very short primary axis taken at 45–47 d under VLDs. Arrowheads indicate the primary axis. Scale bar=1 cm. The inset image shows close-up photographs of primary shoot axes of 56-day-old LD wild-type R108 and Mtsoc1a F3 plants. (I) Graph showing the length of the primary axis of Mtsoc1a F2 homozygous mutants (n=39) after a backcross to R108 as compared with wild-type R108 (n=10). The measurements were taken at 45–50 d in VLDs and the data are shown as the mean ± (t.SE) (0.05).

