Fig. 3.
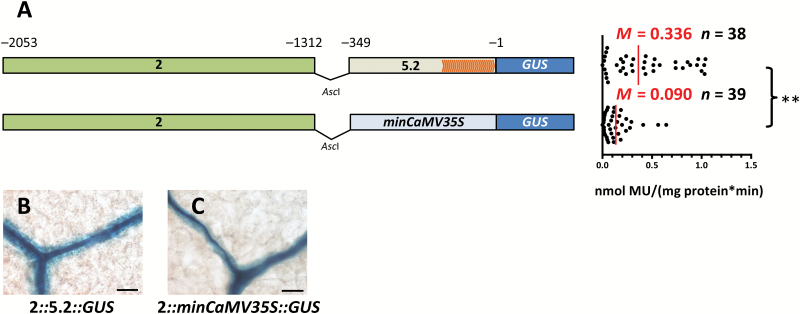
The SULTR2;2 promoter contains a region that is sufficient to activate expression in bundle sheath and veinal cells. (A) Schematic representation of constructs containing nucleotides −2053 to −1312 combined with either the core promoter of SULTR2;2 or the minimal CaMV35S promoter (left) and quantitative analysis of expression from each construct based on the GUS activity assay (right). Orange arrowheads within the core promoter indicate transcription start sites obtained by 5′-RACE. (B, C) Both constructs are sufficient to generate GUS accumulation in the bundle sheath. Data from GUS activity assays include the median (M) indicated by red lines and the number (n) of independent lines. Statistical significance is indicated to the right (**P<0.01). Histological GUS assays were allowed to proceed for 5 h (B) and 22 h (C). Scale bars: 50 µm.

