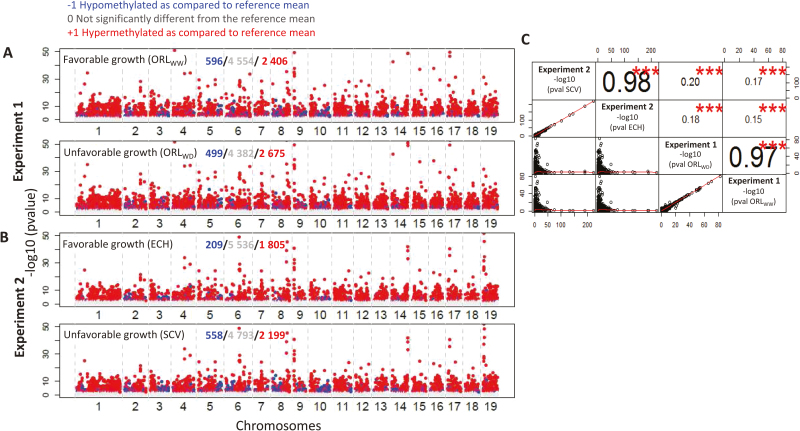
Fig. 4.
Genomic features of DNA methylation changes in poplar shoot apical meristem in response to environmental variations. (A) Experiment 1: Favorable (ORLWW) and unfavorable (ORLWD, unfavorable) growing conditions. (B) Experiment 2: Favorable ( ECH) and unfavorable (SCV) growing conditions. Graphs are based on Manhattan plots from a significant false discovery rate of 5%. The plots show –log10P-values on the y axis, and the location of the different 50 kb windows in the genome with a gap at chromosome locations on the x axis. Blue dots correspond to hypomethylated windows compared with the reference mean, red dots to hypermethylated windows compared with the reference mean, and grey dots to non-significant windows. (C) Relationships (linear correlations) between –log10 of experiment 1 and 2 windows for all growth conditions (n=7550). Lines represent linear regression correlations; numbers represent Pearson’s coefficient (r). *P<0.05, **P<0.01, ***P<0.001; ns, non-significant.

