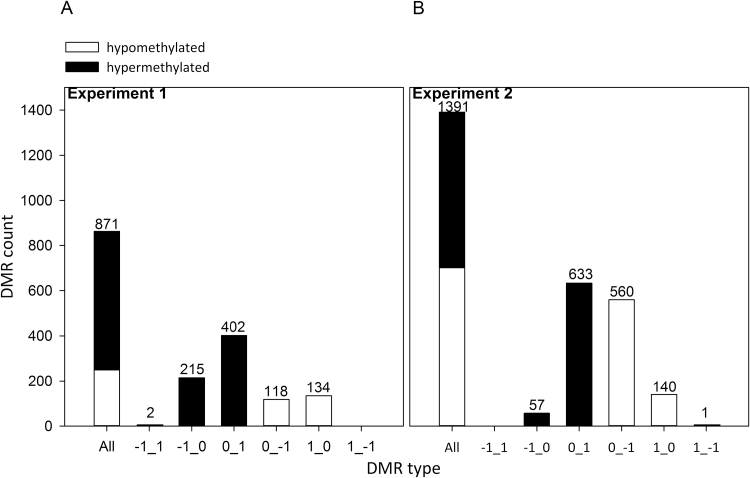
Fig. 6.
Classification of DNA methylation changes (DMRs) for the intensity of variations for (A) experiment 1 and (B) experiment 2. DMRs were split between hypermethylated (black bars) and hypomethylated (white bars) regions. DMR categories were defined by the size of DNA methylation changes between favorable and unfavorable growing conditions (indicated on the x axis as favorable_unfavorable): mild changes from –1 (hypomethylation) to 0 (average methylation) and from 0 to +1 (hypermethylation), or strong changes from –1 (hypomethylation) to +1 (hypermethylation).

