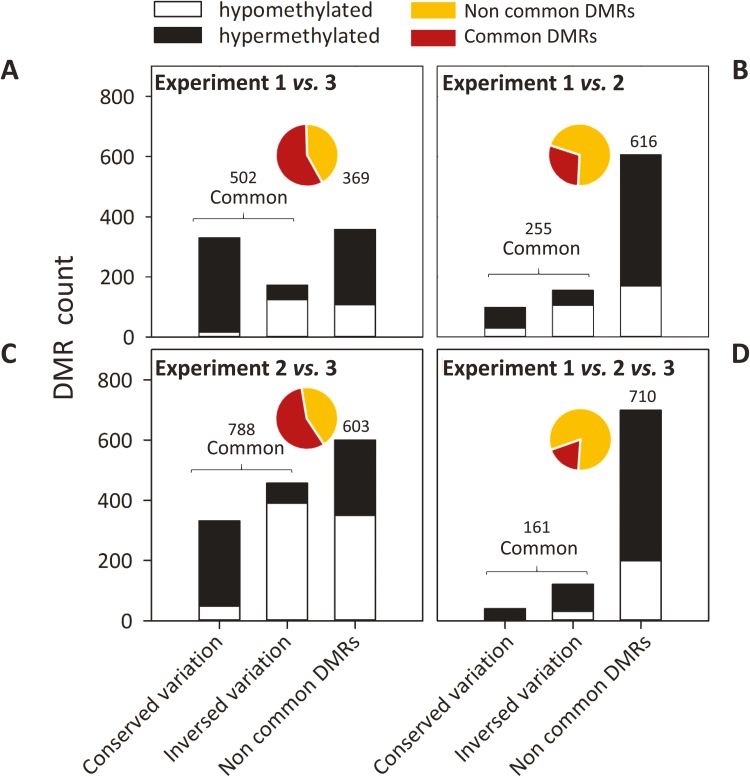
Fig. 7.
Comparison of DMRs among (A) experiments 1 and 3, (B) experiments 1 and 2, (C) experiments 2 and 3, and (D) experiments 1, 2, and 3. DMRs inside an experiment correspond to a genomic region showing a significant variation in DNA methylation between favorable and unfavorable growing conditions. ‘Common’ DMRs correspond to the same DMRs found in at least two experiments (if not, DMRs are labeled ‘non-common’). For the common DMRs, the direction of methylation variation (hyper- or hypomethylation) between favorable and unfavorable growing conditions can be maintained (conserved DMRs) or reversed (inversed DMRs). Values indicate DMR counts for common (red) and non-common (yellow) categories and are represented as pie charts. Black bars correspond to hypermethylated DMRs and white bars to hypomethylated DMRs.

