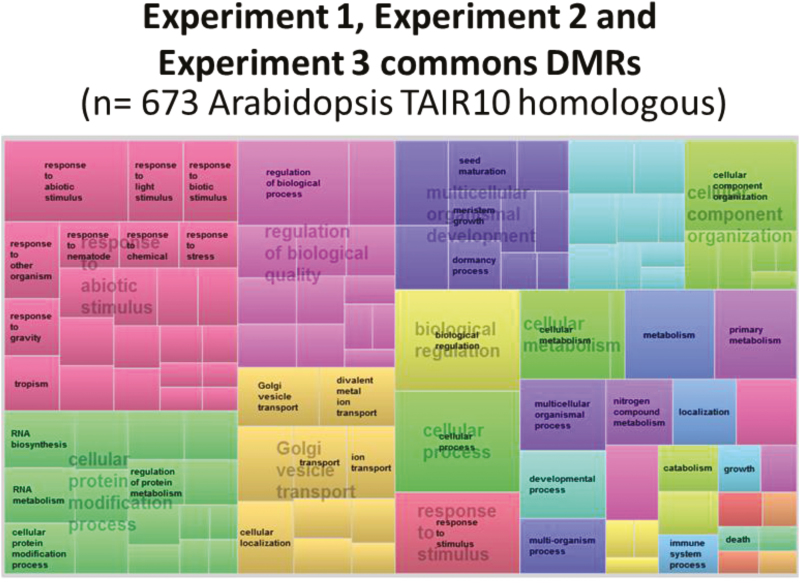
Fig. 8.
Treemap view of REVIGO for biological process on DMRs common to experiments 1, 2 and 3 (n=673 annotations of homologous Arabidopsis genes). Each rectangle is a single cluster representative of TAIR10 corresponding to poplar v3.0 annotations. The representatives are combined into superclusters of loosely related terms, visualized with different colors. Rectangle size is adjusted to reflect the abs log10P-value of the GO term in the underlying Gene Ontology Annotation database.

