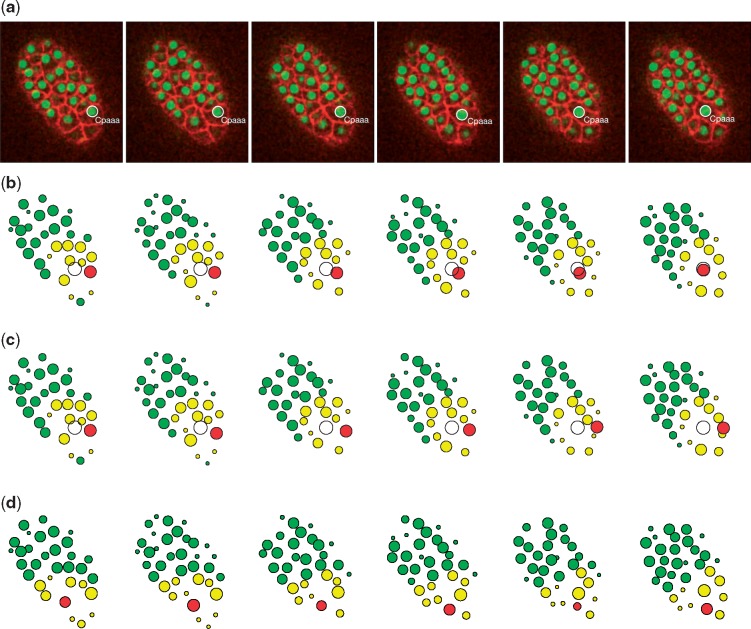
Fig. 7.
Results of the Cpaaa intercalation case. (a) Observation results visualized by Acetree from 3D time-lapse images. (b) Simulation results of the intercalating cell Cpaaa with the Destination rule. (c) Simulation results when training Cpaaa only with the Boundary and Collision rules, without the Destination rule, which indicate that Cpaaa fell into a suboptimal location. (d) Simulation results of the cell Caaaa, a neighbor of Cpaaa. Red, yellow and green circles represent the migration cell, input state cells and non-related cells, respectively. The white circle indicates the destination of the migration cell. All four sets of data were collected at the following time steps: 0, 4, 8, 12, 17 and 22 (minutes from the beginning of the simulation) (Color version of this figure is available at Bioinformatics online.)

