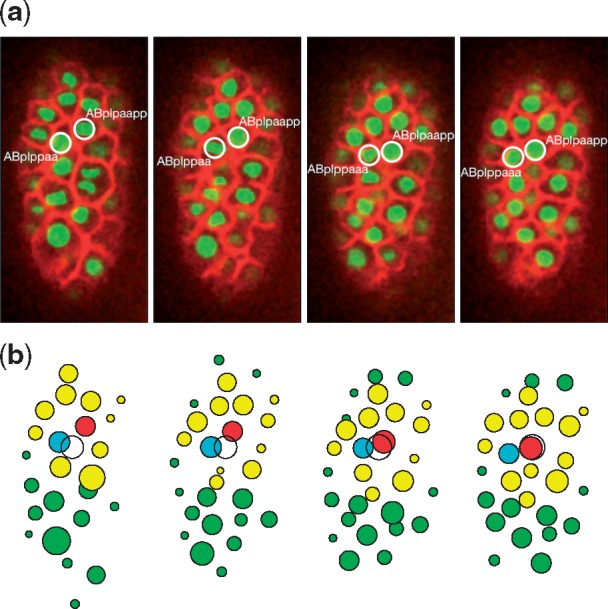
Fig. 9.

The simulation of left-right asymmetry rearrangement. (a) Observation data. The migration cell and the leading cell are circled. (b) Simulation results. The cyan circle represents the leading cell, and the others are color coded, as in Figure 7. The white circle here indicates the destination of the migration cell only for the purpose of visualization. Both sets of data were collected at the following time steps: 0, 3, 6, and 9 (minutes from the beginning of the simulation) (Color version of this figure is available at Bioinformatics online.)
