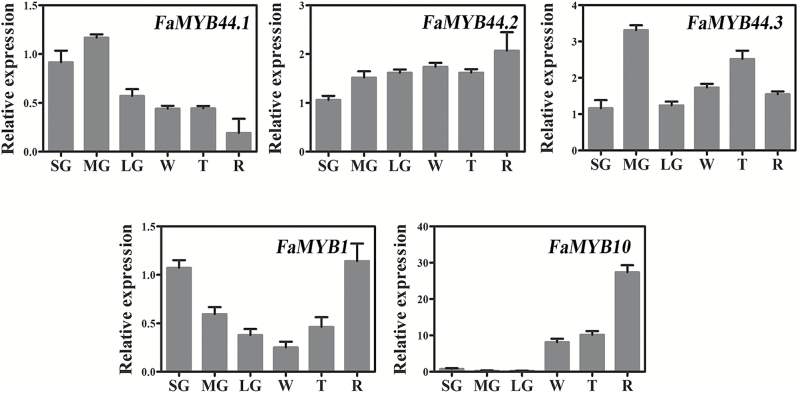
Fig. 2.
The expression patterns of FaMYB44, FaMYB10, and FaMYB1 genes in strawberry fruit at different developmental stages. LG, large green fruit stage; MG, medium green fruit stage; R, fully red stage; SG, small green fruit stage; T, turning stage; W, white fruit stage. Values are means ±SD of three biological replicates normalized using FaACTIN as an internal control. The ΔCT of small green fruit was chosen as the calibrator (Schmittgen & Livak, 2008).

